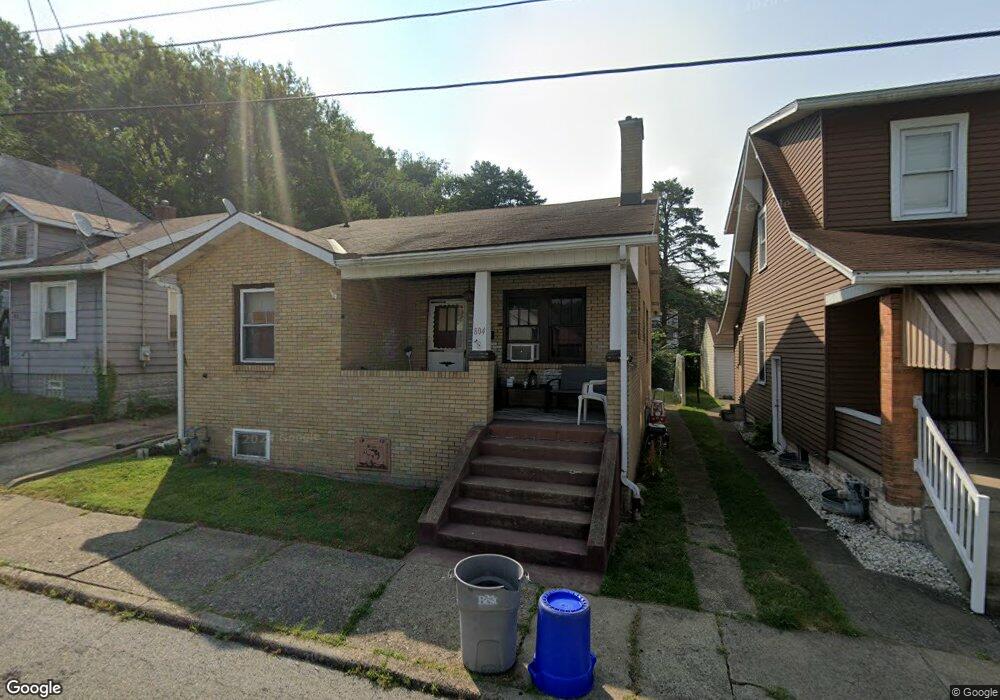
804 4th St New Brighton, PA 15066
Estimated Value: $68,000 - $98,007
2
Beds
1
Bath
1,168
Sq Ft
$76/Sq Ft
Est. Value
About This Home
This home is located at 804 4th St, New Brighton, PA 15066 and is currently estimated at $88,502, approximately $75 per square foot. 804 4th St is a home located in Beaver County with nearby schools including New Brighton Elementary School, New Brighton Area Middle School, and New Brighton Area High School.
Ownership History
Date
Name
Owned For
Owner Type
Purchase Details
Closed on
Oct 28, 2024
Sold by
Warner Gregory D
Bought by
Stone Alice
Current Estimated Value
Purchase Details
Closed on
Feb 1, 2010
Sold by
Wachovia Mortgage Corporation
Bought by
Warner Gregory D and Eaton Marjorie G
Home Financials for this Owner
Home Financials are based on the most recent Mortgage that was taken out on this home.
Original Mortgage
$35,347
Interest Rate
5.5%
Mortgage Type
FHA
Purchase Details
Closed on
Nov 3, 2008
Sold by
Hrapowicki Melissa K and Hrapowicki Christopher M
Bought by
Wachovia Mortgage Corporation
Purchase Details
Closed on
Aug 16, 2002
Sold by
Catanzariti Michael
Bought by
Hrapowicki Christopher
Home Financials for this Owner
Home Financials are based on the most recent Mortgage that was taken out on this home.
Original Mortgage
$56,900
Interest Rate
6.57%
Create a Home Valuation Report for This Property
The Home Valuation Report is an in-depth analysis detailing your home's value as well as a comparison with similar homes in the area
Home Values in the Area
Average Home Value in this Area
Purchase History
| Date | Buyer | Sale Price | Title Company |
|---|---|---|---|
| Stone Alice | -- | None Listed On Document | |
| Warner Gregory D | $36,000 | None Available | |
| Wachovia Mortgage Corporation | $967 | None Available | |
| Hrapowicki Christopher | $56,900 | -- |
Source: Public Records
Mortgage History
| Date | Status | Borrower | Loan Amount |
|---|---|---|---|
| Previous Owner | Warner Gregory D | $35,347 | |
| Previous Owner | Hrapowicki Christopher | $56,900 |
Source: Public Records
Tax History Compared to Growth
Tax History
| Year | Tax Paid | Tax Assessment Tax Assessment Total Assessment is a certain percentage of the fair market value that is determined by local assessors to be the total taxable value of land and additions on the property. | Land | Improvement |
|---|---|---|---|---|
| 2025 | $438 | $38,300 | $9,000 | $29,300 |
| 2024 | $1,565 | $38,300 | $9,000 | $29,300 |
| 2023 | $2,057 | $16,200 | $1,550 | $14,650 |
| 2022 | $2,032 | $16,200 | $1,550 | $14,650 |
| 2021 | $2,033 | $16,200 | $1,550 | $14,650 |
| 2020 | $1,978 | $16,200 | $1,550 | $14,650 |
| 2019 | $1,946 | $16,200 | $1,550 | $14,650 |
| 2018 | $1,871 | $16,200 | $1,550 | $14,650 |
| 2017 | $1,871 | $16,200 | $1,550 | $14,650 |
| 2016 | $1,774 | $16,200 | $1,550 | $14,650 |
| 2015 | $360 | $16,200 | $1,550 | $14,650 |
| 2014 | $360 | $16,200 | $1,550 | $14,650 |
Source: Public Records
Map
Nearby Homes