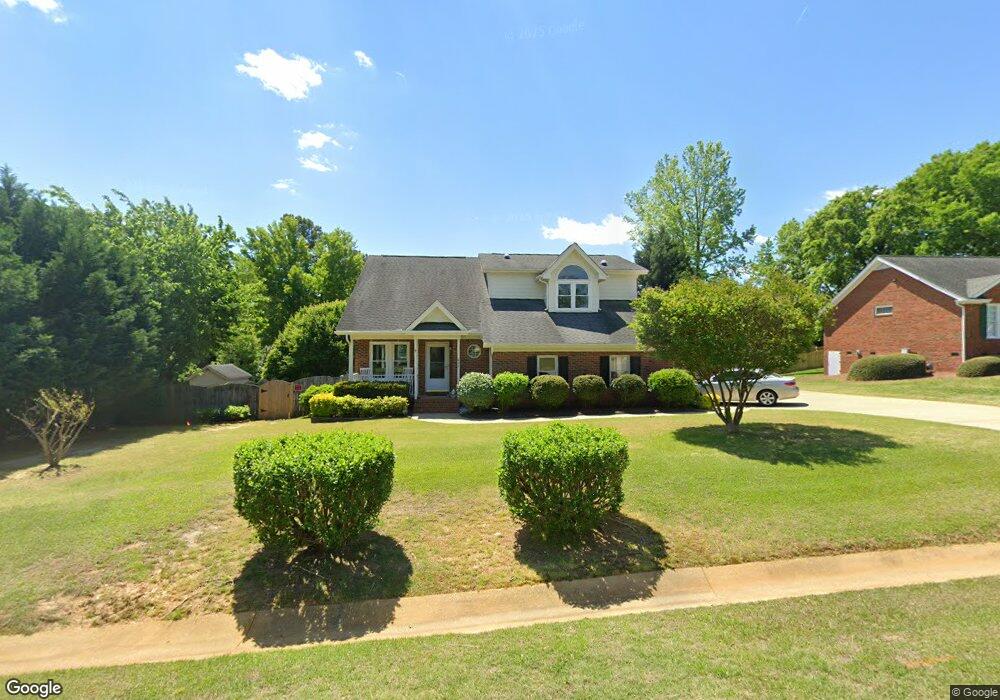
804 Barneswyck Dr Fuquay Varina, NC 27526
Estimated Value: $398,000 - $449,000
3
Beds
3
Baths
1,830
Sq Ft
$229/Sq Ft
Est. Value
About This Home
This home is located at 804 Barneswyck Dr, Fuquay Varina, NC 27526 and is currently estimated at $419,627, approximately $229 per square foot. 804 Barneswyck Dr is a home located in Wake County with nearby schools including Achievement Charter Academy, Southern Wake Academy, and Learning Time Academy.
Ownership History
Date
Name
Owned For
Owner Type
Purchase Details
Closed on
Aug 15, 2025
Sold by
Williams Michael E and Bari Pugh
Bought by
Williams Michael E
Current Estimated Value
Purchase Details
Closed on
Dec 12, 2023
Sold by
Williams Michael E and Pugh Bari
Bought by
Williams Michael E and Williams Bari Pugh
Purchase Details
Closed on
Jun 30, 2006
Sold by
Tran Ba and Tang Linh M Y
Bought by
Williams Michael E
Home Financials for this Owner
Home Financials are based on the most recent Mortgage that was taken out on this home.
Original Mortgage
$141,500
Interest Rate
6.57%
Mortgage Type
Purchase Money Mortgage
Purchase Details
Closed on
Nov 13, 1997
Sold by
Barnes Builders & Realty Inc
Bought by
Tran Ba and Tang Linn My
Home Financials for this Owner
Home Financials are based on the most recent Mortgage that was taken out on this home.
Original Mortgage
$137,700
Interest Rate
6.5%
Create a Home Valuation Report for This Property
The Home Valuation Report is an in-depth analysis detailing your home's value as well as a comparison with similar homes in the area
Home Values in the Area
Average Home Value in this Area
Purchase History
| Date | Buyer | Sale Price | Title Company |
|---|---|---|---|
| Williams Michael E | -- | None Listed On Document | |
| Williams Michael E | -- | None Listed On Document | |
| Williams Michael E | $189,000 | None Available | |
| Tran Ba | $153,000 | -- |
Source: Public Records
Mortgage History
| Date | Status | Borrower | Loan Amount |
|---|---|---|---|
| Previous Owner | Williams Michael E | $141,500 | |
| Previous Owner | Tran Ba | $137,700 |
Source: Public Records
Tax History Compared to Growth
Tax History
| Year | Tax Paid | Tax Assessment Tax Assessment Total Assessment is a certain percentage of the fair market value that is determined by local assessors to be the total taxable value of land and additions on the property. | Land | Improvement |
|---|---|---|---|---|
| 2025 | -- | $432,253 | $105,000 | $327,253 |
| 2024 | $3,787 | $432,253 | $105,000 | $327,253 |
| 2023 | $2,912 | $260,115 | $48,000 | $212,115 |
| 2022 | $2,737 | $260,115 | $48,000 | $212,115 |
| 2021 | $2,550 | $254,263 | $48,000 | $206,263 |
| 2020 | $2,425 | $241,679 | $48,000 | $193,679 |
| 2019 | $2,363 | $203,187 | $42,000 | $161,187 |
| 2018 | $2,228 | $203,187 | $42,000 | $161,187 |
| 2017 | $2,148 | $203,187 | $42,000 | $161,187 |
| 2016 | $0 | $203,187 | $42,000 | $161,187 |
| 2015 | -- | $209,187 | $38,000 | $171,187 |
| 2014 | -- | $209,187 | $38,000 | $171,187 |
Source: Public Records
Map
Nearby Homes
- 918 Kensley Grove Ln
- 918 Kensley Grove Ln Unit 66
- 917 Kensley Grove Ln
- 917 Kensley Grove Ln Unit 31
- 919 Kensley Grove Ln Unit 32
- Litchfield Plan at Kensley Grove
- 922 Kensley Grove Ln
- 922 Kensley Grove Ln Unit 64
- 934 Kensley Grove Ln
- 934 Kensley Grove Ln Unit 60
- 924 Kensley Grove Ln
- 924 Kensley Grove Ln Unit 63
- 928 Kensley Grove Ln Unit 61
- 747 Creekway Dr
- 804 Kensley Grove Ln Unit 9
- 806 Kensley Grove Ln Unit 8
- 548 Barneswyck Dr
- 425 Pine Burr St
- 1021 Old Baron Dr
- 516 Barneswyck Dr
- 806 Barneswyck Dr
- 802 Barneswyck Dr
- 807 Old Baron Dr
- 805 Old Baron Dr
- 803 Barneswyck Dr
- 805 Barneswyck Dr
- 800 Barneswyck Dr
- 809 Old Baron Dr
- 808 Barneswyck Dr
- 701 Oldwyck Dr
- 801 Barneswyck Dr
- 803 Old Baron Dr
- 807 Barneswyck Dr
- 703 Oldwyck Dr
- 806 Old Baron Dr
- 801 Old Baron Dr
- 1113 Hodgson Ln Unit Lot 8
- 1109 Hodgson Ln
- 705 Oldwyck Dr
- 809 Barneswyck Dr