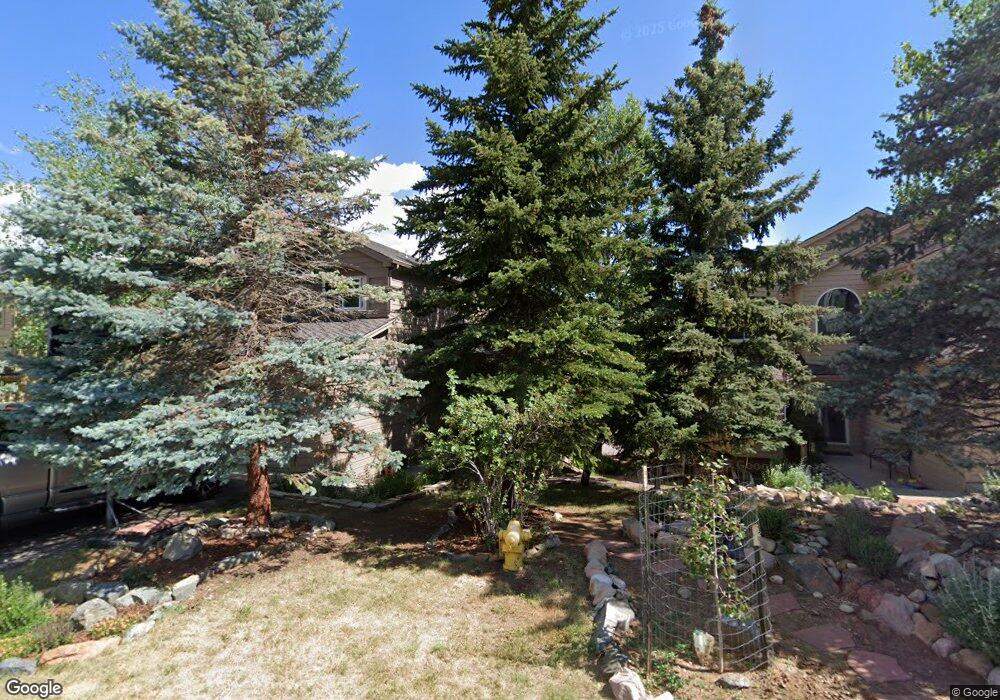
804 Calgary Way Golden, CO 80401
Estimated Value: $864,481 - $982,000
4
Beds
5
Baths
2,219
Sq Ft
$421/Sq Ft
Est. Value
About This Home
This home is located at 804 Calgary Way, Golden, CO 80401 and is currently estimated at $934,370, approximately $421 per square foot. 804 Calgary Way is a home located in Jefferson County with nearby schools including Ralston Elementary School, Bell Middle School, and Golden High School.
Ownership History
Date
Name
Owned For
Owner Type
Purchase Details
Closed on
Jun 28, 2000
Sold by
Holp Wilbur C
Bought by
Beeman Douglass C and Beeman Suzanne C
Current Estimated Value
Home Financials for this Owner
Home Financials are based on the most recent Mortgage that was taken out on this home.
Original Mortgage
$293,300
Outstanding Balance
$102,273
Interest Rate
7.87%
Estimated Equity
$832,097
Purchase Details
Closed on
May 17, 1999
Sold by
Deweerdt Mary S and Deweerdt Michael K
Bought by
Holp Wilbur C
Home Financials for this Owner
Home Financials are based on the most recent Mortgage that was taken out on this home.
Original Mortgage
$90,000
Interest Rate
6.94%
Purchase Details
Closed on
Feb 27, 1995
Sold by
Richmond Homes Inc Ii
Bought by
Deweerdt Mary S and Deweerdt Michael K
Home Financials for this Owner
Home Financials are based on the most recent Mortgage that was taken out on this home.
Original Mortgage
$198,700
Interest Rate
9%
Create a Home Valuation Report for This Property
The Home Valuation Report is an in-depth analysis detailing your home's value as well as a comparison with similar homes in the area
Home Values in the Area
Average Home Value in this Area
Purchase History
| Date | Buyer | Sale Price | Title Company |
|---|---|---|---|
| Beeman Douglass C | $325,900 | -- | |
| Holp Wilbur C | $283,000 | -- | |
| Deweerdt Mary S | $220,785 | Land Title |
Source: Public Records
Mortgage History
| Date | Status | Borrower | Loan Amount |
|---|---|---|---|
| Open | Beeman Douglass C | $293,300 | |
| Previous Owner | Holp Wilbur C | $90,000 | |
| Previous Owner | Deweerdt Mary S | $198,700 |
Source: Public Records
Tax History Compared to Growth
Tax History
| Year | Tax Paid | Tax Assessment Tax Assessment Total Assessment is a certain percentage of the fair market value that is determined by local assessors to be the total taxable value of land and additions on the property. | Land | Improvement |
|---|---|---|---|---|
| 2024 | $4,625 | $48,017 | $7,889 | $40,128 |
| 2023 | $4,625 | $48,017 | $7,889 | $40,128 |
| 2022 | $4,490 | $44,986 | $7,986 | $37,000 |
| 2021 | $4,534 | $46,280 | $8,215 | $38,065 |
| 2020 | $3,886 | $39,788 | $4,584 | $35,204 |
| 2019 | $3,774 | $39,788 | $4,584 | $35,204 |
| 2018 | $3,310 | $33,712 | $4,295 | $29,417 |
| 2017 | $3,084 | $33,712 | $4,295 | $29,417 |
| 2016 | $3,368 | $34,510 | $8,887 | $25,623 |
| 2015 | $3,023 | $34,510 | $8,887 | $25,623 |
| 2014 | $3,023 | $28,392 | $6,892 | $21,500 |
Source: Public Records
Map
Nearby Homes
- 23979 High Meadow Dr
- 23726 Pondview Place Unit H
- 23712 Pondview Place Unit A
- 23705 Bluestem Dr
- 23666 Genesee Village Rd
- 23624 Pondview Place Unit G
- 23612 Pondview Place Unit A
- 23821 Genesee Village Rd
- 23860 Genesee Village Rd
- 23551 Genesee Village Rd Unit H
- 23846 Genesee Village Rd
- 23558 Pondview Place Unit B
- 23518 Pondview Place Unit B
- 23485 Bluestem Dr
- 1037 Dogwood Dr
- 1139 Genesee Vista Rd
- 661 Trailside Dr Unit 661
- 1269 Pomegranate Ln
- 968 Eastwood Dr
- 24140 Us Highway 40
- 812 Calgary Way
- 802 Calgary Way
- 814 Calgary Way
- 822 Calgary Way
- 23999 High Meadow Dr
- 23989 High Meadow Dr
- 24009 High Meadow Dr
- 23985 High Meadow Dr
- 793 Calgary Way
- 824 Calgary Way
- 24019 High Meadow Dr
- 781 Calgary Way
- 832 Calgary Way
- 24025 High Meadow Dr
- 23975 High Meadow Dr
- 834 Calgary Way
- 773 Calgary Way
- 782 Calgary Way
- 842 Calgary Way
- 884 Calgary Way