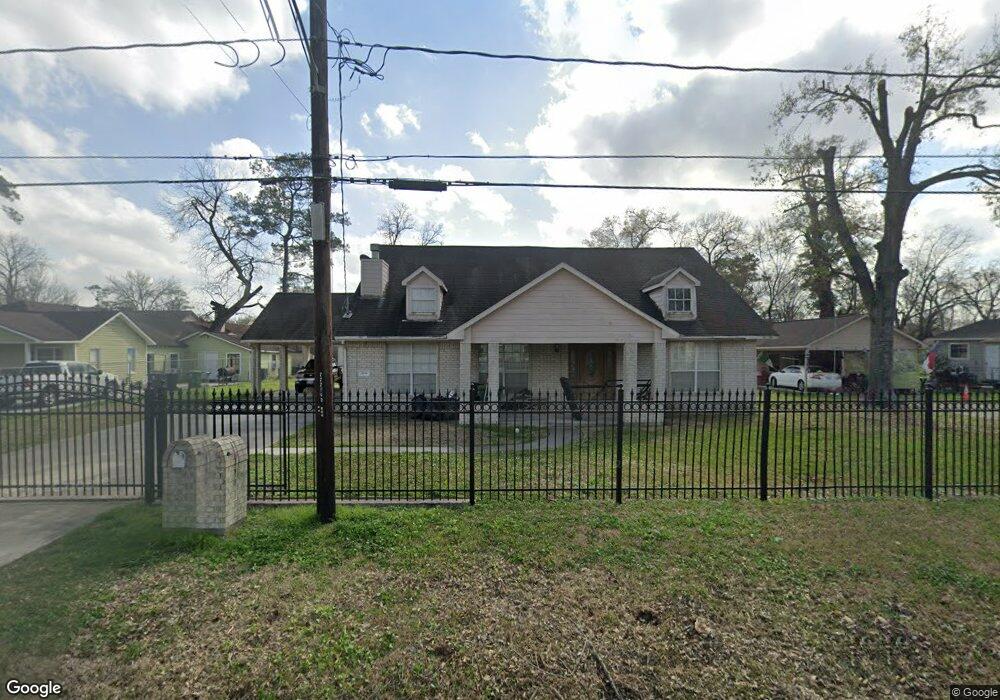
804 De Boll St Houston, TX 77022
Northside-Northline NeighborhoodEstimated Value: $351,000 - $417,360
1
Bed
2
Baths
1,080
Sq Ft
$343/Sq Ft
Est. Value
About This Home
This home is located at 804 De Boll St, Houston, TX 77022 and is currently estimated at $370,340, approximately $342 per square foot. 804 De Boll St is a home located in Harris County with nearby schools including Burbank Elementary School, Burbank Middle School, and Sam Houston Math, Science & Technology Center.
Ownership History
Date
Name
Owned For
Owner Type
Purchase Details
Closed on
Mar 15, 2024
Sold by
Galindo Jose N and Galindo Nora E
Bought by
Galindo Jose N and Galindo Nora E
Current Estimated Value
Purchase Details
Closed on
Oct 6, 2000
Sold by
Seara Enrique
Bought by
Galindo Jose N and Galindo Nora E
Home Financials for this Owner
Home Financials are based on the most recent Mortgage that was taken out on this home.
Original Mortgage
$56,525
Interest Rate
7.96%
Create a Home Valuation Report for This Property
The Home Valuation Report is an in-depth analysis detailing your home's value as well as a comparison with similar homes in the area
Home Values in the Area
Average Home Value in this Area
Purchase History
| Date | Buyer | Sale Price | Title Company |
|---|---|---|---|
| Galindo Jose N | -- | None Listed On Document | |
| Galindo Jose N | -- | -- |
Source: Public Records
Mortgage History
| Date | Status | Borrower | Loan Amount |
|---|---|---|---|
| Previous Owner | Galindo Jose N | $56,525 |
Source: Public Records
Tax History Compared to Growth
Tax History
| Year | Tax Paid | Tax Assessment Tax Assessment Total Assessment is a certain percentage of the fair market value that is determined by local assessors to be the total taxable value of land and additions on the property. | Land | Improvement |
|---|---|---|---|---|
| 2025 | $337 | $313,309 | $205,200 | $108,109 |
| 2024 | $337 | $453,362 | $188,325 | $265,037 |
| 2023 | $337 | $497,278 | $114,750 | $382,528 |
| 2022 | $1,104 | $413,027 | $114,750 | $298,277 |
| 2021 | $6,423 | $333,955 | $114,750 | $219,205 |
| 2020 | $6,067 | $305,439 | $114,750 | $190,689 |
| 2019 | $5,763 | $297,513 | $94,500 | $203,013 |
| 2018 | $1,108 | $239,259 | $78,975 | $160,284 |
| 2017 | $4,759 | $239,259 | $78,975 | $160,284 |
| 2016 | $4,327 | $196,836 | $74,250 | $122,586 |
| 2015 | $1,426 | $155,557 | $54,000 | $101,557 |
| 2014 | $1,426 | $155,557 | $54,000 | $101,557 |
Source: Public Records
Map
Nearby Homes
- 807 Firnat St
- 702 Pennington St
- 723 Doverside St
- 9026 Mcgallion Rd
- 1207 Firnat St
- 88 Berry Rd
- 318 Charlock St
- 8411 Berry Brush Ln
- 411 Berry Rd
- 8402 Berry Green Ln
- 1104 Charnwood St
- 802 Berry Sage Ln
- 253 De Boll St
- 249 De Boll St
- 216 Burress St
- 8205 Appleton St
- 415 Briarcliff Dr
- 631 Apache St
- 743 Apache St
- 132 Grothe Ln