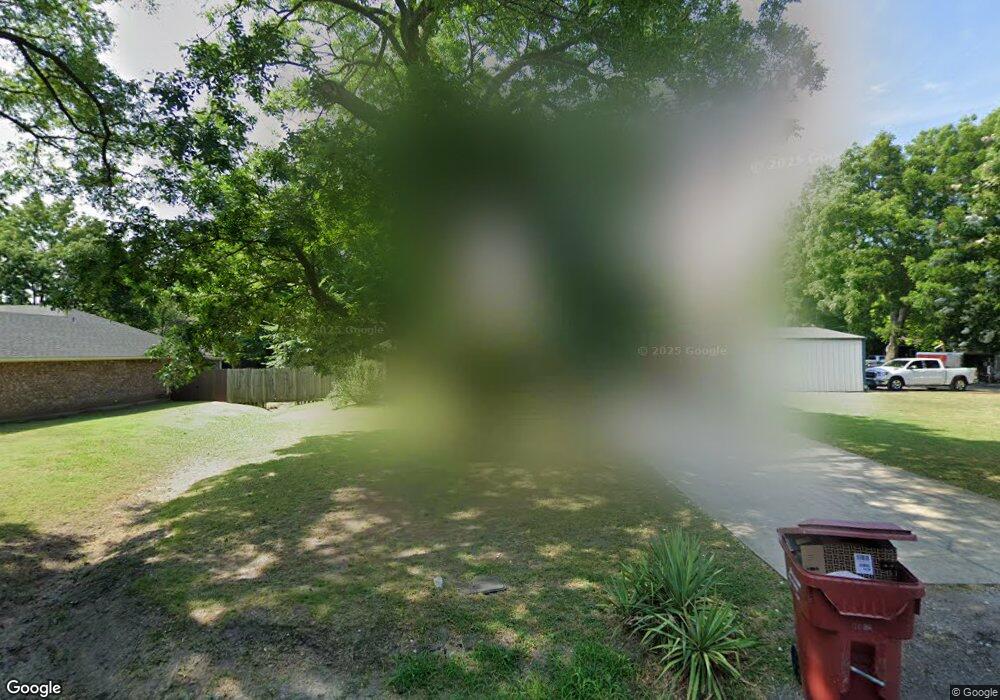
804 E 11th St Bonham, TX 75418
Estimated Value: $224,000 - $255,000
3
Beds
2
Baths
1,831
Sq Ft
$132/Sq Ft
Est. Value
About This Home
This home is located at 804 E 11th St, Bonham, TX 75418 and is currently estimated at $241,759, approximately $132 per square foot. 804 E 11th St is a home located in Fannin County with nearby schools including Evans Elementary School, Finley-Oates Elementary School, and LH Rather Jr High School.
Ownership History
Date
Name
Owned For
Owner Type
Purchase Details
Closed on
Sep 14, 2024
Sold by
Grace Libby D
Bought by
Grace Libby D and Grace Nathan Dale
Current Estimated Value
Purchase Details
Closed on
Dec 16, 2009
Sold by
Crossland Rickey D and Crossland Patricia A
Bought by
Grace Libby D
Home Financials for this Owner
Home Financials are based on the most recent Mortgage that was taken out on this home.
Original Mortgage
$116,326
Interest Rate
5.01%
Mortgage Type
New Conventional
Create a Home Valuation Report for This Property
The Home Valuation Report is an in-depth analysis detailing your home's value as well as a comparison with similar homes in the area
Purchase History
| Date | Buyer | Sale Price | Title Company |
|---|---|---|---|
| Grace Libby D | -- | None Listed On Document | |
| Grace Libby D | $116,000 | None Available |
Source: Public Records
Mortgage History
| Date | Status | Borrower | Loan Amount |
|---|---|---|---|
| Previous Owner | Grace Libby D | $116,326 |
Source: Public Records
Tax History
| Year | Tax Paid | Tax Assessment Tax Assessment Total Assessment is a certain percentage of the fair market value that is determined by local assessors to be the total taxable value of land and additions on the property. | Land | Improvement |
|---|---|---|---|---|
| 2025 | $5,149 | $265,490 | $46,780 | $218,710 |
| 2024 | $3,824 | $261,030 | $44,760 | $216,270 |
| 2023 | $4,334 | $262,740 | $41,970 | $220,770 |
| 2022 | $4,395 | $236,250 | $29,540 | $206,710 |
| 2021 | $4,592 | $181,670 | $14,810 | $166,860 |
| 2020 | $4,487 | $175,980 | $11,750 | $164,230 |
| 2019 | $4,241 | $160,870 | $5,520 | $155,350 |
| 2018 | $3,850 | $151,370 | $5,520 | $145,850 |
| 2017 | $3,371 | $131,880 | $4,920 | $126,960 |
| 2016 | $3,086 | $120,740 | $4,920 | $115,820 |
| 2015 | -- | $120,740 | $4,700 | $116,040 |
| 2014 | -- | $117,050 | $5,370 | $111,680 |
Source: Public Records
Map
Nearby Homes
Your Personal Tour Guide
Ask me questions while you tour the home.