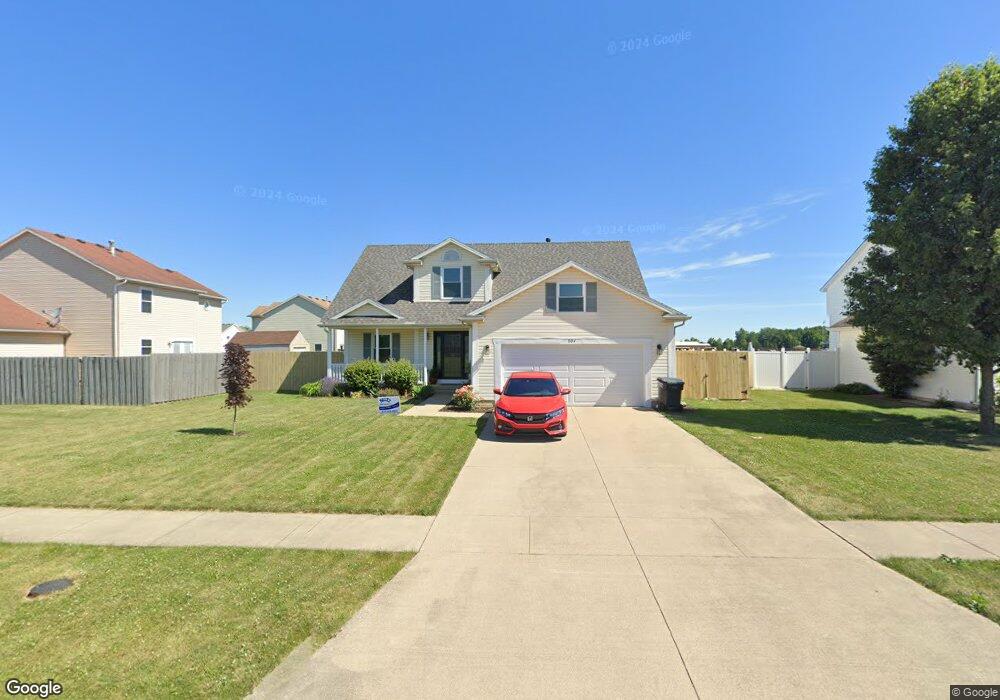
804 Foley St North Baltimore, OH 45872
Estimated Value: $219,000 - $278,122
3
Beds
3
Baths
1,991
Sq Ft
$129/Sq Ft
Est. Value
About This Home
This home is located at 804 Foley St, North Baltimore, OH 45872 and is currently estimated at $256,281, approximately $128 per square foot. 804 Foley St is a home located in Wood County with nearby schools including E.A. Powell Elementary School, North Baltimore Middle School, and North Baltimore High School.
Ownership History
Date
Name
Owned For
Owner Type
Purchase Details
Closed on
Apr 20, 2023
Sold by
Medley Morgan C and Morey Morgan C
Bought by
Medley Alexander D
Current Estimated Value
Purchase Details
Closed on
Mar 28, 2022
Sold by
Kochis Michael J and Dulaney Jennette E
Bought by
Medley Alexander D
Purchase Details
Closed on
Jun 28, 2004
Sold by
Dold William H and Dold Mary Lou
Bought by
Dold Investment Co
Home Financials for this Owner
Home Financials are based on the most recent Mortgage that was taken out on this home.
Original Mortgage
$1,030,000
Interest Rate
6.46%
Mortgage Type
Purchase Money Mortgage
Purchase Details
Closed on
Jun 27, 2002
Sold by
Dold Homes Inc
Bought by
Dold William H and Dold Mary Lou
Home Financials for this Owner
Home Financials are based on the most recent Mortgage that was taken out on this home.
Original Mortgage
$120,750
Interest Rate
6.93%
Create a Home Valuation Report for This Property
The Home Valuation Report is an in-depth analysis detailing your home's value as well as a comparison with similar homes in the area
Home Values in the Area
Average Home Value in this Area
Purchase History
| Date | Buyer | Sale Price | Title Company |
|---|---|---|---|
| Medley Alexander D | -- | None Listed On Document | |
| Medley Alexander D | $207,000 | None Listed On Document | |
| Dold Investment Co | -- | -- | |
| Dold William H | -- | -- |
Source: Public Records
Mortgage History
| Date | Status | Borrower | Loan Amount |
|---|---|---|---|
| Previous Owner | Dold Investment Co | $1,030,000 | |
| Previous Owner | Dold William H | $120,750 |
Source: Public Records
Tax History Compared to Growth
Tax History
| Year | Tax Paid | Tax Assessment Tax Assessment Total Assessment is a certain percentage of the fair market value that is determined by local assessors to be the total taxable value of land and additions on the property. | Land | Improvement |
|---|---|---|---|---|
| 2024 | $3,329 | $74,760 | $8,855 | $65,905 |
| 2023 | $3,329 | $74,770 | $8,860 | $65,910 |
| 2022 | $2,975 | $55,790 | $8,050 | $47,740 |
| 2021 | $2,913 | $55,790 | $8,050 | $47,740 |
| 2020 | $2,999 | $55,790 | $8,050 | $47,740 |
| 2019 | $2,859 | $50,440 | $8,050 | $42,390 |
| 2018 | $2,857 | $50,440 | $8,050 | $42,390 |
| 2017 | $2,956 | $50,440 | $8,050 | $42,390 |
| 2016 | $2,591 | $47,220 | $8,050 | $39,170 |
| 2015 | $2,591 | $47,220 | $8,050 | $39,170 |
| 2014 | $2,684 | $47,220 | $8,050 | $39,170 |
| 2013 | $2,948 | $47,220 | $8,050 | $39,170 |
Source: Public Records
Map
Nearby Homes
- Lot 112 Foley Run
- 211 Patterson Place
- 206 Rudolph Rd
- 209 Rudolph Rd
- 0 Eagleville Rd
- 12078 Eagleville Rd
- 128 Zihlman St
- 112 N Beecher St
- 815 George St
- 930 E Broadway St
- 233 & 235 N Main St
- 201 Briar Hill Rd
- 323 W State St
- 318 Belmont St
- 117 S Main St
- 11755 State Route 613
- 308 S Main St
- 16864 Oil Center Rd
- 9991 State Route 613
- 0 S Dixie Hwy
- 804 Foley Run Dr
- 806 Foley St
- 206 Patterson Place
- 212 Patterson Place
- 800 Foley St
- 216 Patterson Place
- 805 Foley Run
- 812 Foley Run
- 812 Foley St
- 801 Foley St
- 207 Patterson Place
- 201 Patterson St
- 205 Patterson Place
- 813 Foley St
- 803 Foley St
- 807 Foley St
- 810 Foley St
- 809 Foley St
- 814 Foley St
- 224 Patterson Place