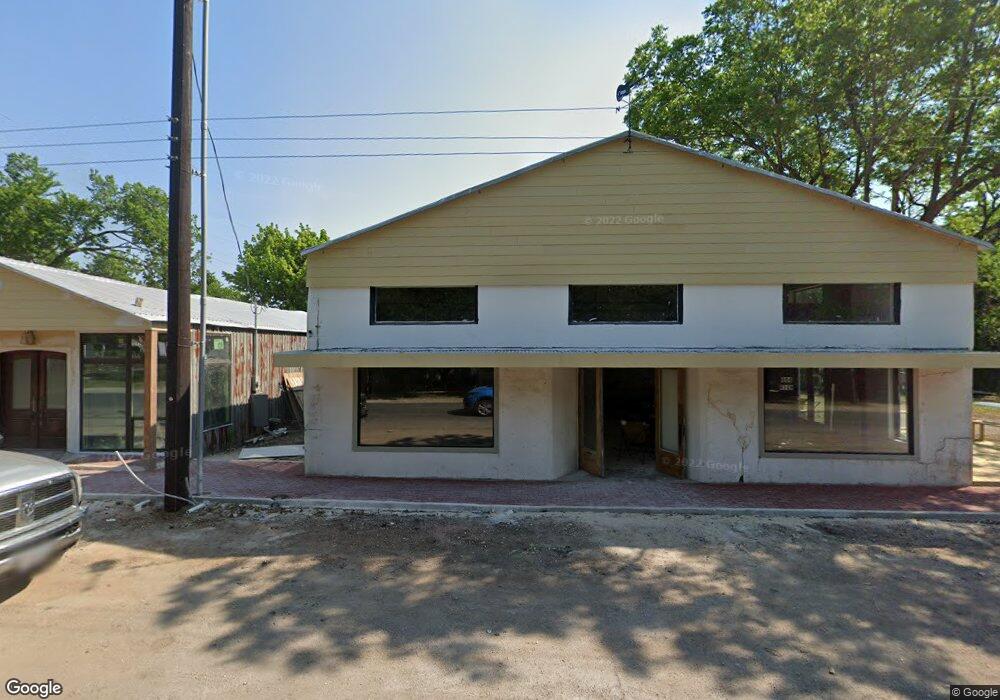
804 High St Unit B Comfort, TX 78013
Estimated Value: $448,000
Studio
1
Bath
4,578
Sq Ft
$98/Sq Ft
Est. Value
About This Home
This home is located at 804 High St Unit B, Comfort, TX 78013 and is currently priced at $448,000, approximately $97 per square foot. 804 High St Unit B is a home located in Kendall County with nearby schools including Comfort Elementary School, Comfort Middle School, and Comfort High School.
Ownership History
Date
Name
Owned For
Owner Type
Purchase Details
Closed on
May 10, 2021
Sold by
Llll Investments Llc
Bought by
Trube John
Current Estimated Value
Purchase Details
Closed on
Sep 23, 2019
Sold by
Waller Thomas W
Bought by
Llll Investments Llc
Home Financials for this Owner
Home Financials are based on the most recent Mortgage that was taken out on this home.
Original Mortgage
$158,900
Interest Rate
3.6%
Mortgage Type
New Conventional
Create a Home Valuation Report for This Property
The Home Valuation Report is an in-depth analysis detailing your home's value as well as a comparison with similar homes in the area
Purchase History
| Date | Buyer | Sale Price | Title Company |
|---|---|---|---|
| Trube John | -- | Guaranty Title | |
| Llll Investments Llc | -- | Guaranty Title Of Boerne Llc |
Source: Public Records
Mortgage History
| Date | Status | Borrower | Loan Amount |
|---|---|---|---|
| Previous Owner | Llll Investments Llc | $158,900 |
Source: Public Records
Tax History
| Year | Tax Paid | Tax Assessment Tax Assessment Total Assessment is a certain percentage of the fair market value that is determined by local assessors to be the total taxable value of land and additions on the property. | Land | Improvement |
|---|---|---|---|---|
| 2025 | $5,992 | $800,000 | $144,382 | $655,618 |
| 2024 | $5,992 | $800,000 | $144,382 | $655,618 |
| 2023 | $4,992 | $331,480 | $188,750 | $142,730 |
| 2022 | $3,712 | $215,870 | $107,860 | $108,010 |
| 2021 | $2,506 | $128,510 | $51,360 | $77,150 |
| 2020 | $2,373 | $128,290 | $51,140 | $77,150 |
| 2019 | $2,526 | $128,290 | $51,140 | $77,150 |
| 2018 | $3,101 | $160,270 | $79,260 | $81,010 |
| 2017 | $3,064 | $160,270 | $79,260 | $81,010 |
| 2016 | $3,064 | $160,270 | $79,260 | $81,010 |
| 2015 | $2,503 | $160,270 | $79,260 | $81,010 |
| 2014 | $2,503 | $160,270 | $79,260 | $81,010 |
| 2013 | -- | $160,270 | $79,260 | $81,010 |
Source: Public Records
Map
Nearby Homes
- 7400 Texas 27
- 125 Other
- 0 Hasenwinkel Rd
- 000 High St Unit 129D
- 000 High St
- 1006 High St
- 609 Water St Unit 273
- 705 Altgelt St
- 17 Fm 473
- 710 Fifth St
- 000 OUTLOT 11 Pankratz Rd
- TBD East St
- 107 High St
- 107 Lillis Ln
- 1101 Fifth St
- 141 Manor Dr
- 1132 5th St
- 105 Oleander Rd
- 105A Oleander Rd Unit 14/4
- 105A Oleander Rd
Your Personal Tour Guide
Ask me questions while you tour the home.