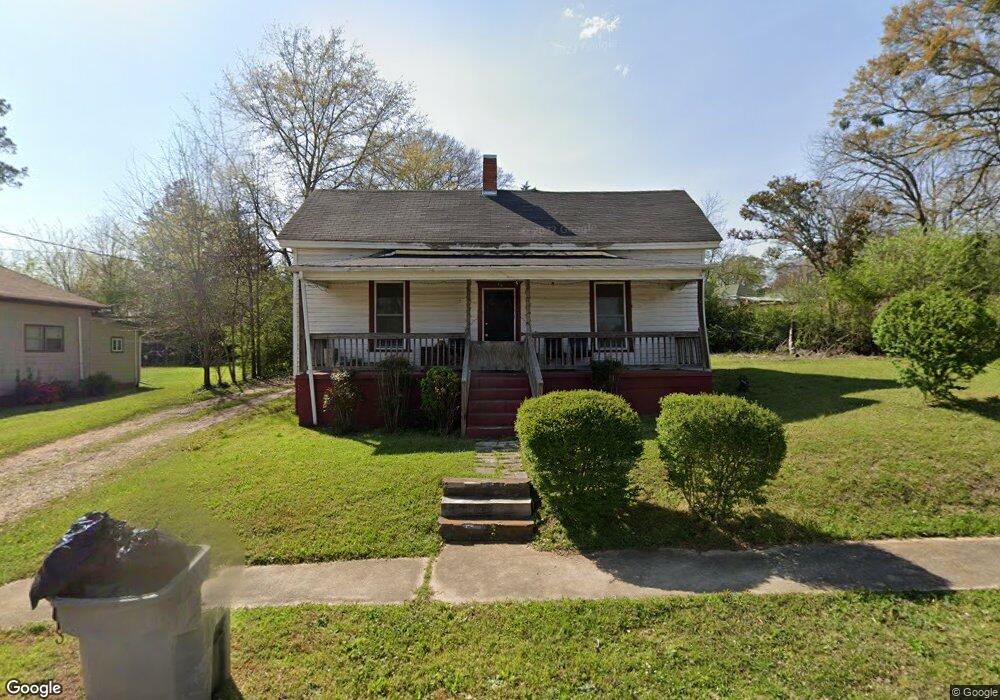
804 Leeman St Lagrange, GA 30240
Estimated Value: $77,011 - $132,000
2
Beds
1
Bath
1,204
Sq Ft
$78/Sq Ft
Est. Value
About This Home
This home is located at 804 Leeman St, Lagrange, GA 30240 and is currently estimated at $93,503, approximately $77 per square foot. 804 Leeman St is a home located in Troup County with nearby schools including Ethel W. Kight Elementary School, Hollis Hand Elementary School, and Franklin Forest Elementary School.
Ownership History
Date
Name
Owned For
Owner Type
Purchase Details
Closed on
Feb 24, 2021
Sold by
Schmitt James J
Bought by
Schmitt James J and Schmitt Caroline
Current Estimated Value
Purchase Details
Closed on
Aug 23, 2007
Sold by
Vowell Bonnie Sue
Bought by
Schmitt James J
Home Financials for this Owner
Home Financials are based on the most recent Mortgage that was taken out on this home.
Original Mortgage
$31,800
Interest Rate
6.65%
Mortgage Type
New Conventional
Purchase Details
Closed on
Jan 12, 2005
Sold by
Vowell Jimmy
Bought by
Vowell Bonnie Sue
Purchase Details
Closed on
Oct 27, 1997
Sold by
Bell Sam
Bought by
Jimmy Vowell
Purchase Details
Closed on
Aug 13, 1997
Sold by
Eula B Reese
Bought by
Bell Sam
Purchase Details
Closed on
May 31, 1979
Sold by
Bell Samuel D and Bell Alice I
Bought by
Eula B Reese
Purchase Details
Closed on
Sep 9, 1975
Sold by
Mallory Richard H
Bought by
Bell Samuel D and Bell Alice I
Purchase Details
Closed on
Oct 1, 1964
Sold by
Gable L Romonia
Bought by
Mallory Richard H
Create a Home Valuation Report for This Property
The Home Valuation Report is an in-depth analysis detailing your home's value as well as a comparison with similar homes in the area
Purchase History
| Date | Buyer | Sale Price | Title Company |
|---|---|---|---|
| Schmitt James J | -- | -- | |
| Schmitt James J | $30,000 | -- | |
| Vowell Bonnie Sue | -- | -- | |
| Jimmy Vowell | $18,000 | -- | |
| Bell Sam | -- | -- | |
| Eula B Reese | -- | -- | |
| Bell Samuel D | $9,000 | -- | |
| Mallory Richard H | -- | -- |
Source: Public Records
Mortgage History
| Date | Status | Borrower | Loan Amount |
|---|---|---|---|
| Previous Owner | Schmitt James J | $31,800 |
Source: Public Records
Tax History
| Year | Tax Paid | Tax Assessment Tax Assessment Total Assessment is a certain percentage of the fair market value that is determined by local assessors to be the total taxable value of land and additions on the property. | Land | Improvement |
|---|---|---|---|---|
| 2025 | $761 | $27,920 | $3,880 | $24,040 |
| 2024 | $655 | $24,000 | $3,880 | $20,120 |
| 2023 | $649 | $23,800 | $3,880 | $19,920 |
| 2022 | $585 | $20,960 | $3,880 | $17,080 |
| 2021 | $440 | $14,600 | $3,880 | $10,720 |
| 2020 | $440 | $14,600 | $3,880 | $10,720 |
| 2019 | $405 | $13,440 | $3,880 | $9,560 |
| 2018 | $408 | $13,544 | $3,984 | $9,560 |
| 2017 | $408 | $13,544 | $3,984 | $9,560 |
| 2016 | $395 | $13,098 | $3,984 | $9,114 |
| 2015 | $326 | $10,786 | $3,899 | $6,886 |
| 2014 | $315 | $10,423 | $3,899 | $6,524 |
| 2013 | -- | $15,136 | $3,856 | $11,280 |
Source: Public Records
Map
Nearby Homes
- 806 Leeman St
- 808 Leeman St
- 301 Miller St
- 809 Truitt Ave
- 811 Truitt Ave
- 803 Truitt Ave
- 813 Truitt Ave
- 801 Truitt Ave
- 808 Truitt Ave
- 208 Miller St
- 816 Truitt Ave
- 411 Miller St
- 714 S Greenwood St
- 413 Miller St
- 818 Truitt Ave
- 712 S Greenwood St
- 410 Miller St
- 409 Miller St Unit 1
- 409 Miller St
- 204 Dallis St
Your Personal Tour Guide
Ask me questions while you tour the home.