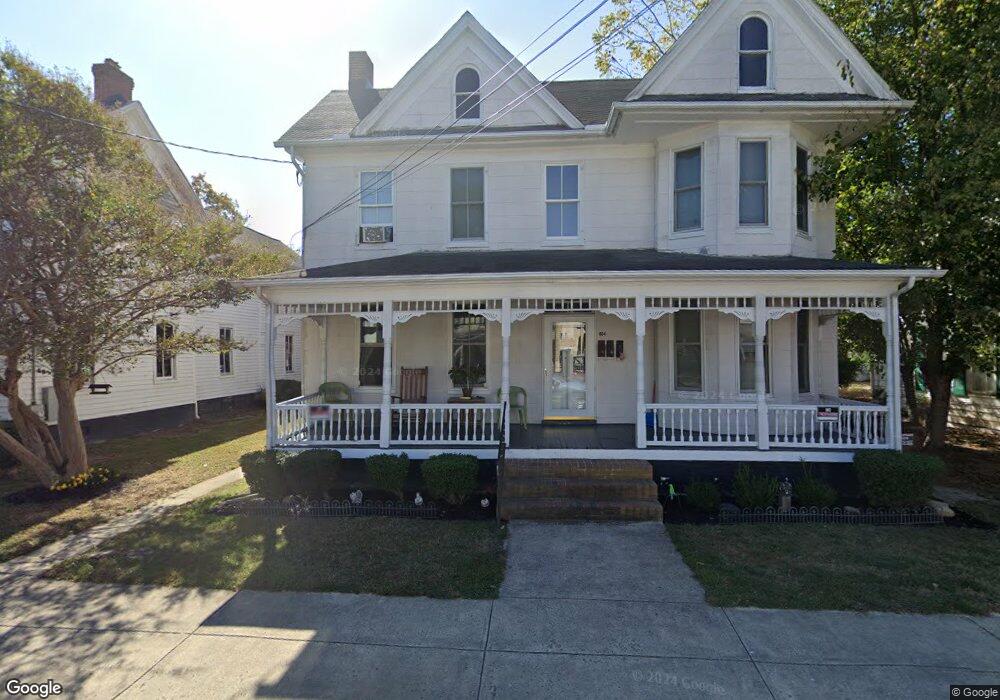
804 Locust St Cambridge, MD 21613
Estimated Value: $153,000 - $273,000
Studio
3
Baths
1,890
Sq Ft
$110/Sq Ft
Est. Value
About This Home
This home is located at 804 Locust St, Cambridge, MD 21613 and is currently estimated at $207,120, approximately $109 per square foot. 804 Locust St is a home located in Dorchester County with nearby schools including Sandy Hill Elementary School, Mace's Lane Middle School, and Cambridge-South Dorchester High School.
Ownership History
Date
Name
Owned For
Owner Type
Purchase Details
Closed on
Aug 27, 2007
Sold by
Shore Alliance For Independent
Bought by
Main Street Housing Inc
Current Estimated Value
Purchase Details
Closed on
Nov 8, 2000
Sold by
Heckler Mark W and Heckler Janet M
Bought by
Shore Alliance For Independent
Purchase Details
Closed on
Apr 30, 1985
Sold by
Tomey David A and Tomey Martha B
Bought by
Heckler Mark W and Heckler Janet M
Create a Home Valuation Report for This Property
The Home Valuation Report is an in-depth analysis detailing your home's value as well as a comparison with similar homes in the area
Home Values in the Area
Average Home Value in this Area
Purchase History
| Date | Buyer | Sale Price | Title Company |
|---|---|---|---|
| Main Street Housing Inc | -- | -- | |
| Shore Alliance For Independent | $61,000 | -- | |
| Heckler Mark W | $50,000 | -- |
Source: Public Records
Mortgage History
| Date | Status | Borrower | Loan Amount |
|---|---|---|---|
| Closed | Shore Alliance For Independent | -- |
Source: Public Records
Tax History
| Year | Tax Paid | Tax Assessment Tax Assessment Total Assessment is a certain percentage of the fair market value that is determined by local assessors to be the total taxable value of land and additions on the property. | Land | Improvement |
|---|---|---|---|---|
| 2025 | -- | $119,700 | $30,600 | $89,100 |
| 2024 | -- | $112,133 | $0 | $0 |
| 2023 | -- | $104,567 | $0 | $0 |
| 2022 | $1,079 | $97,000 | $30,600 | $66,400 |
| 2020 | -- | $89,267 | $0 | $0 |
| 2019 | -- | $85,400 | $21,500 | $63,900 |
| 2018 | $807 | $85,400 | $21,500 | $63,900 |
| 2017 | $807 | $85,400 | $0 | $0 |
| 2016 | -- | $85,400 | $0 | $0 |
| 2015 | -- | $85,400 | $0 | $0 |
| 2014 | -- | $85,400 | $0 | $0 |
Source: Public Records
Map
Nearby Homes
- 810 Locust St
- 817 Locust St
- 321 Choptank Ave
- 709 Church St
- 700 Church St
- 402 Oakley St
- 307 Willis St
- 0 Edgewood Ave Unit MDDO2010918
- 0 Edgewood Ave Unit MDDO2010930
- 0 Edgewood Ave Unit MDDO2010928
- 0 Edgewood Ave Unit MDDO2010924
- 0 Edgewood Ave Unit MDDO2010926
- 0 Edgewood Ave Unit MDDO2010932
- 409 Oakley St
- 210 Choptank Ave
- 314 Belvedere Ave
- 211 Choptank Ave
- 306 Belvedere Ave
- 1105 Holland Ave
- 0 Park Ln
Your Personal Tour Guide
Ask me questions while you tour the home.