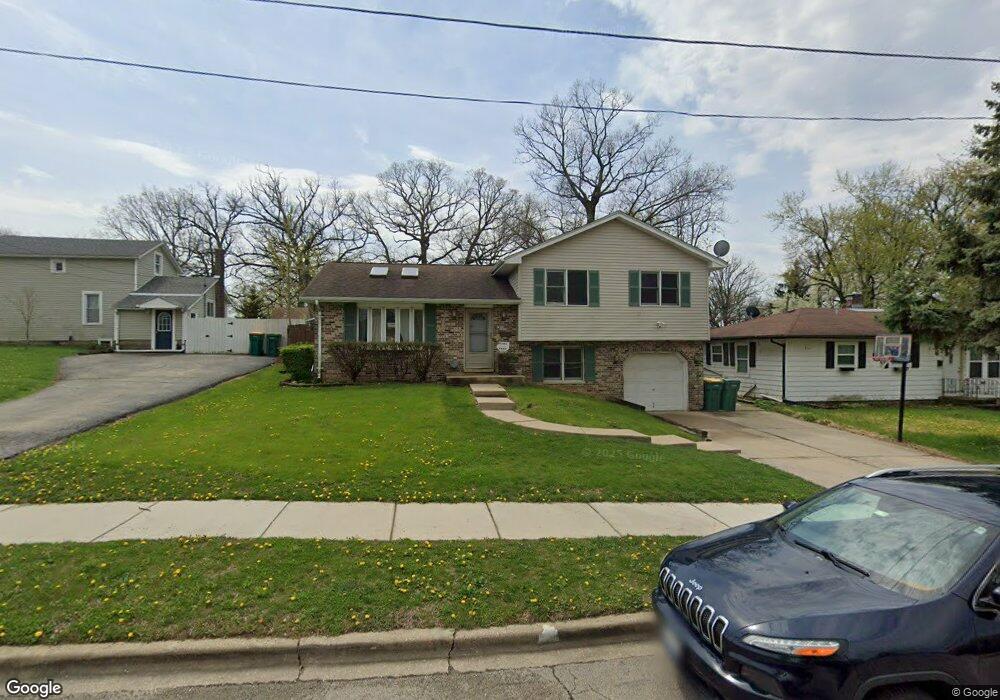
804 Morgan St Joliet, IL 60436
Reedwood NeighborhoodEstimated Value: $221,287 - $273,000
3
Beds
--
Bath
1,100
Sq Ft
$228/Sq Ft
Est. Value
About This Home
This home is located at 804 Morgan St, Joliet, IL 60436 and is currently estimated at $250,322, approximately $227 per square foot. 804 Morgan St is a home located in Will County with nearby schools including Lynne Thigpen Elementary School, Dirksen Junior High School, and Joliet Central High School.
Ownership History
Date
Name
Owned For
Owner Type
Purchase Details
Closed on
Oct 31, 2000
Sold by
Dean Barry L
Bought by
Castillo Lisa A and Maldonado Jose R
Current Estimated Value
Home Financials for this Owner
Home Financials are based on the most recent Mortgage that was taken out on this home.
Original Mortgage
$114,950
Outstanding Balance
$42,447
Interest Rate
7.91%
Estimated Equity
$207,875
Purchase Details
Closed on
Apr 30, 1997
Sold by
Lesh Edward A and Lesh Susan I
Bought by
Dean Barry L
Home Financials for this Owner
Home Financials are based on the most recent Mortgage that was taken out on this home.
Original Mortgage
$88,800
Interest Rate
8.05%
Purchase Details
Closed on
Mar 7, 1995
Sold by
King Donald G
Bought by
Larson Susan I
Home Financials for this Owner
Home Financials are based on the most recent Mortgage that was taken out on this home.
Original Mortgage
$101,650
Interest Rate
9.13%
Purchase Details
Closed on
Jun 17, 1993
Sold by
Lasalle National Trust N A
Bought by
King Donald G
Create a Home Valuation Report for This Property
The Home Valuation Report is an in-depth analysis detailing your home's value as well as a comparison with similar homes in the area
Home Values in the Area
Average Home Value in this Area
Purchase History
| Date | Buyer | Sale Price | Title Company |
|---|---|---|---|
| Castillo Lisa A | $121,000 | Chicago Title Insurance Co | |
| Dean Barry L | $111,000 | -- | |
| Larson Susan I | $107,000 | Chicago Title Insurance Co | |
| King Donald G | $20,000 | -- |
Source: Public Records
Mortgage History
| Date | Status | Borrower | Loan Amount |
|---|---|---|---|
| Open | Castillo Lisa A | $114,950 | |
| Previous Owner | Dean Barry L | $88,800 | |
| Previous Owner | Larson Susan I | $101,650 | |
| Closed | Castillo Lisa A | $3,000 |
Source: Public Records
Tax History
| Year | Tax Paid | Tax Assessment Tax Assessment Total Assessment is a certain percentage of the fair market value that is determined by local assessors to be the total taxable value of land and additions on the property. | Land | Improvement |
|---|---|---|---|---|
| 2024 | $5,384 | $72,283 | $15,355 | $56,928 |
| 2023 | $5,384 | $64,223 | $13,643 | $50,580 |
| 2022 | $5,016 | $58,094 | $12,341 | $45,753 |
| 2021 | $4,535 | $54,258 | $11,526 | $42,732 |
| 2020 | $4,275 | $51,527 | $10,946 | $40,581 |
| 2019 | $4,025 | $47,888 | $10,173 | $37,715 |
| 2018 | $3,680 | $42,936 | $9,109 | $33,827 |
| 2017 | $3,413 | $39,037 | $8,282 | $30,755 |
| 2016 | $3,215 | $35,911 | $7,587 | $28,324 |
| 2015 | $2,965 | $32,900 | $7,150 | $25,750 |
| 2014 | $2,965 | $32,700 | $7,100 | $25,600 |
| 2013 | $2,965 | $36,009 | $7,909 | $28,100 |
Source: Public Records
Map
Nearby Homes
Your Personal Tour Guide
Ask me questions while you tour the home.