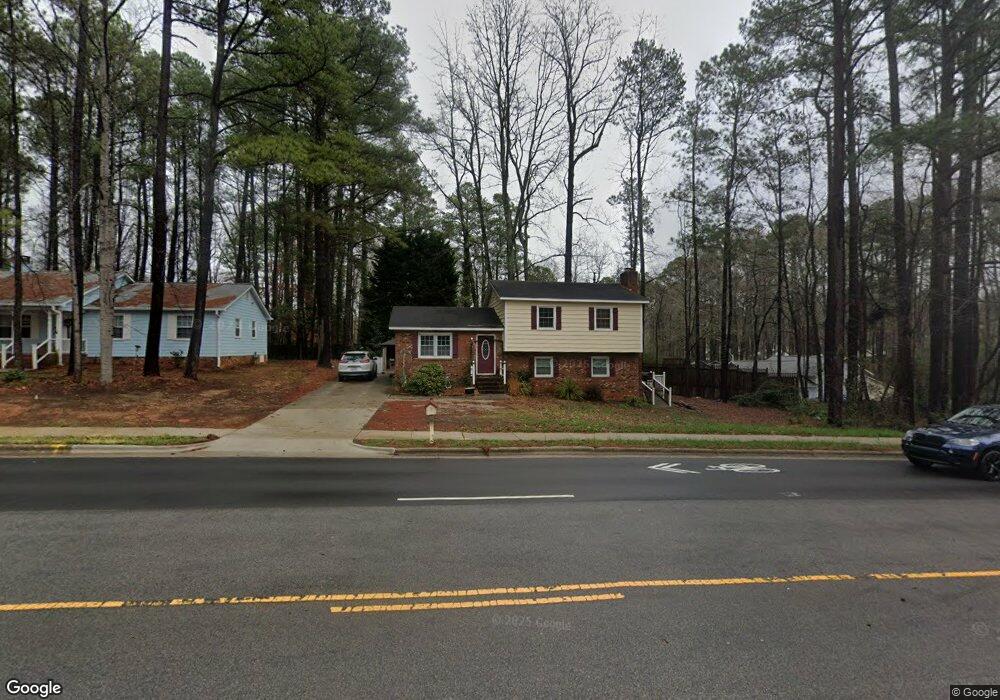
804 NW Maynard Rd Cary, NC 27513
West Cary NeighborhoodEstimated Value: $369,711 - $428,000
Studio
3
Baths
1,660
Sq Ft
$246/Sq Ft
Est. Value
About This Home
This home is located at 804 NW Maynard Rd, Cary, NC 27513 and is currently estimated at $408,928, approximately $246 per square foot. 804 NW Maynard Rd is a home located in Wake County with nearby schools including Briarcliff Elementary School, East Cary Middle School, and Cary High School.
Ownership History
Date
Name
Owned For
Owner Type
Purchase Details
Closed on
Sep 25, 2020
Sold by
Kerner Gemimah
Bought by
Kerner Gemimah
Current Estimated Value
Home Financials for this Owner
Home Financials are based on the most recent Mortgage that was taken out on this home.
Original Mortgage
$221,508
Outstanding Balance
$195,230
Interest Rate
2.9%
Mortgage Type
FHA
Estimated Equity
$213,698
Purchase Details
Closed on
Nov 21, 2019
Sold by
Rodriguez Gemimah A and Kerner Gemimah
Bought by
Kerner Gemimah
Home Financials for this Owner
Home Financials are based on the most recent Mortgage that was taken out on this home.
Original Mortgage
$222,405
Interest Rate
3.5%
Mortgage Type
FHA
Purchase Details
Closed on
Apr 5, 2011
Sold by
Rodriguez Jose
Bought by
Rodriguez Gemimah A
Purchase Details
Closed on
May 12, 2006
Sold by
Moore Stephen Jason and Sato Elly
Bought by
Rodriguez Jose and Rodriguez Gemimah A
Home Financials for this Owner
Home Financials are based on the most recent Mortgage that was taken out on this home.
Original Mortgage
$106,400
Interest Rate
6.33%
Mortgage Type
New Conventional
Create a Home Valuation Report for This Property
The Home Valuation Report is an in-depth analysis detailing your home's value as well as a comparison with similar homes in the area
Home Values in the Area
Average Home Value in this Area
Purchase History
| Date | Buyer | Sale Price | Title Company |
|---|---|---|---|
| Kerner Gemimah | -- | None Available | |
| Kerner Gemimah | -- | None Listed On Document | |
| Kerner Gemimah | -- | None Listed On Document | |
| Rodriguez Gemimah A | -- | None Available | |
| Rodriguez Jose | $133,000 | None Available |
Source: Public Records
Mortgage History
| Date | Status | Borrower | Loan Amount |
|---|---|---|---|
| Open | Kerner Gemimah | $221,508 | |
| Closed | Kerner Gemimah | $221,508 | |
| Previous Owner | Kerner Gemimah | $222,405 | |
| Previous Owner | Rodriguez Jose | $106,400 | |
| Previous Owner | Rodriguez Jose | $26,600 |
Source: Public Records
Tax History
| Year | Tax Paid | Tax Assessment Tax Assessment Total Assessment is a certain percentage of the fair market value that is determined by local assessors to be the total taxable value of land and additions on the property. | Land | Improvement |
|---|---|---|---|---|
| 2025 | $2,927 | $339,212 | $165,000 | $174,212 |
| 2024 | $2,864 | $339,212 | $165,000 | $174,212 |
| 2023 | $2,100 | $207,578 | $92,250 | $115,328 |
| 2022 | $2,022 | $207,578 | $92,250 | $115,328 |
| 2021 | $1,982 | $207,578 | $92,250 | $115,328 |
| 2020 | $1,992 | $207,578 | $92,250 | $115,328 |
| 2019 | $1,824 | $168,486 | $71,250 | $97,236 |
| 2018 | $1,712 | $168,486 | $71,250 | $97,236 |
| 2017 | $1,646 | $168,486 | $71,250 | $97,236 |
| 2016 | $1,621 | $168,486 | $71,250 | $97,236 |
| 2015 | $1,363 | $136,393 | $38,000 | $98,393 |
| 2014 | -- | $136,393 | $38,000 | $98,393 |
Source: Public Records
Map
Nearby Homes
- 1008 Castalia Dr
- 136 Lake Hollow Cir
- 1209 Cedar Creek Dr
- 631 Springfork Dr Unit 5C3
- 132 Edgehill Pkwy
- 109 Virginia Place
- 1027 Castalia Dr
- 209 High House Rd
- 136 Orchard Park Dr
- 207 High House Rd
- 101 Hedgerow Ct
- 217 Oakmere Dr
- 111 Cimmaron Ct
- 133 Oakmere Dr
- 143 Hedgerow Ct
- 206 Vista Creek Place
- 102 Joel Ct
- 117 Red Bud Ct
- 100 Hunting Chase Unit 1D
- 203 Wood Hollow Dr
- 1220 Roundtree Ct
- 806 NW Maynard Rd
- 1218 Roundtree Ct
- 803 NW Maynard Rd
- 805 NW Maynard Rd
- 1221 Roundtree Ct
- 808 NW Maynard Rd
- 807 NW Maynard Rd
- 1216 Roundtree Ct
- 802 NW Maynard Rd
- 809 NW Maynard Rd
- 1219 Roundtree Ct
- 102 Honeysuckle Ln
- 911 Castalia Dr
- 1214 Roundtree Ct
- 909 Castalia Dr
- 1230 Cedar Creek Dr
- 1228 Cedar Creek Dr
- 811 NW Maynard Rd
- 104 Honeysuckle Ln
Your Personal Tour Guide
Ask me questions while you tour the home.