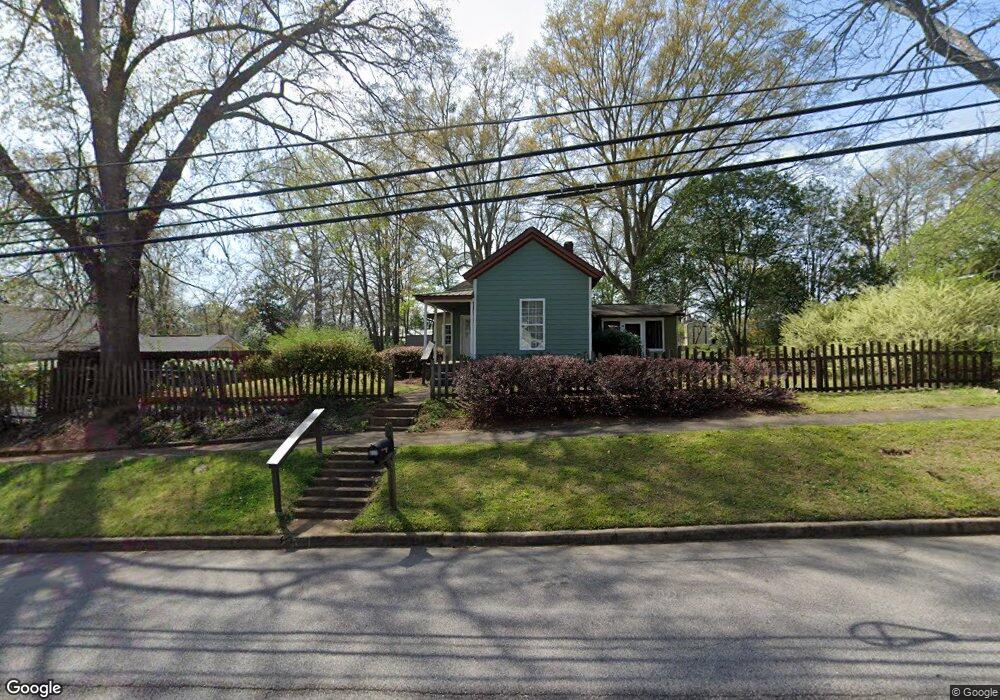
804 Park Ave Unit 8 Lagrange, GA 30240
Estimated Value: $186,000 - $212,000
2
Beds
2
Baths
1,320
Sq Ft
$152/Sq Ft
Est. Value
About This Home
This home is located at 804 Park Ave Unit 8, Lagrange, GA 30240 and is currently estimated at $200,733, approximately $152 per square foot. 804 Park Ave Unit 8 is a home located in Troup County with nearby schools including Berta Weathersbee Elementary School, Whitesville Road Elementary School, and Rosemont Elementary School.
Ownership History
Date
Name
Owned For
Owner Type
Purchase Details
Closed on
Nov 21, 2024
Sold by
Gotch Thomas
Bought by
Lane Savannah
Current Estimated Value
Home Financials for this Owner
Home Financials are based on the most recent Mortgage that was taken out on this home.
Original Mortgage
$196,377
Outstanding Balance
$194,572
Interest Rate
6.54%
Mortgage Type
New Conventional
Estimated Equity
$6,161
Purchase Details
Closed on
Dec 6, 2005
Sold by
Midfirst Bank
Bought by
Sec Of Veterans Affairs
Purchase Details
Closed on
Aug 23, 2001
Sold by
Chas Wm Cooley Exec
Bought by
Hayward Copeland
Purchase Details
Closed on
May 8, 1970
Sold by
Fincher John Z and Fincher Corine B
Bought by
Chas Wm Cooley Exec
Purchase Details
Closed on
Jul 1, 1959
Sold by
Brazeal Carrie
Bought by
Fincher John Z and Fincher Corine B
Create a Home Valuation Report for This Property
The Home Valuation Report is an in-depth analysis detailing your home's value as well as a comparison with similar homes in the area
Home Values in the Area
Average Home Value in this Area
Purchase History
| Date | Buyer | Sale Price | Title Company |
|---|---|---|---|
| Lane Savannah | $200,000 | -- | |
| Sec Of Veterans Affairs | $29,965 | -- | |
| Midfirst Bank | $29,965 | -- | |
| Hayward Copeland | $40,000 | -- | |
| Chas Wm Cooley Exec | $4,000 | -- | |
| Fincher John Z | -- | -- |
Source: Public Records
Mortgage History
| Date | Status | Borrower | Loan Amount |
|---|---|---|---|
| Open | Lane Savannah | $196,377 |
Source: Public Records
Tax History Compared to Growth
Tax History
| Year | Tax Paid | Tax Assessment Tax Assessment Total Assessment is a certain percentage of the fair market value that is determined by local assessors to be the total taxable value of land and additions on the property. | Land | Improvement |
|---|---|---|---|---|
| 2024 | $192 | $29,288 | $2,880 | $26,408 |
| 2023 | $156 | $25,608 | $2,880 | $22,728 |
| 2022 | $152 | $24,328 | $2,880 | $21,448 |
| 2021 | $127 | $21,172 | $2,880 | $18,292 |
| 2020 | $428 | $21,172 | $2,880 | $18,292 |
| 2019 | $376 | $19,448 | $2,880 | $16,568 |
| 2018 | $381 | $19,612 | $2,884 | $16,728 |
| 2017 | $381 | $19,612 | $2,884 | $16,728 |
| 2016 | $374 | $19,374 | $2,884 | $16,490 |
| 2015 | $375 | $19,374 | $2,884 | $16,490 |
| 2014 | $349 | $18,506 | $2,884 | $15,622 |
| 2013 | -- | $19,788 | $2,884 | $16,904 |
Source: Public Records
Map
Nearby Homes