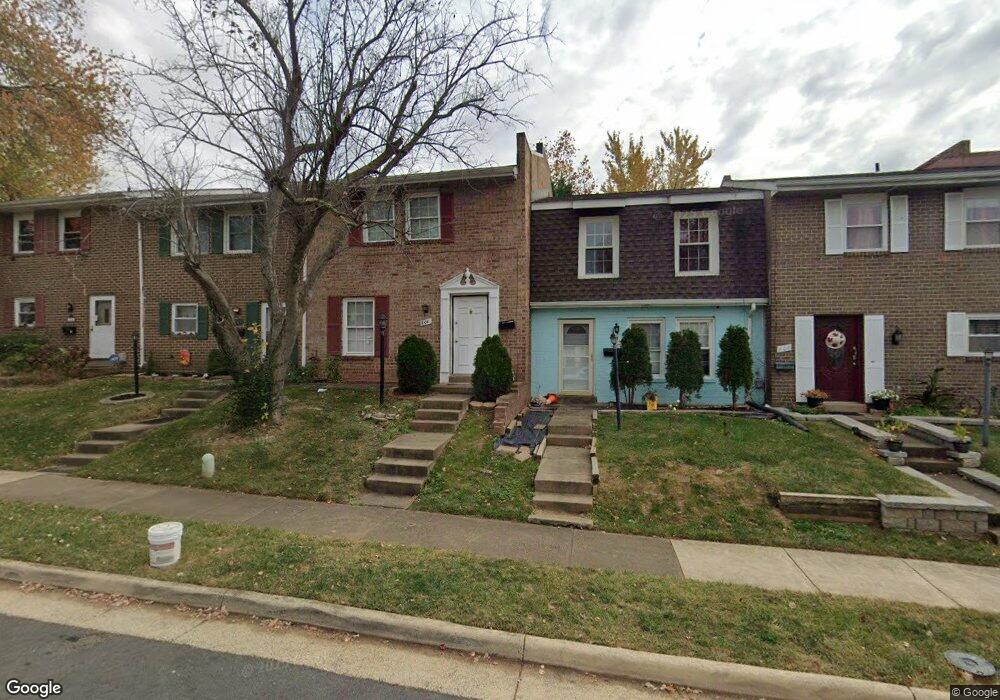
804 S Concord Ct Sterling, VA 20164
Estimated Value: $387,538 - $401,000
3
Beds
2
Baths
1,280
Sq Ft
$306/Sq Ft
Est. Value
About This Home
This home is located at 804 S Concord Ct, Sterling, VA 20164 and is currently estimated at $392,179, approximately $306 per square foot. 804 S Concord Ct is a home located in Loudoun County with nearby schools including Forest Grove Elementary School, Sterling Middle School, and Park View High School.
Ownership History
Date
Name
Owned For
Owner Type
Purchase Details
Closed on
Feb 18, 2016
Sold by
Vasquez Romelia C
Bought by
Vasquez Vasquez Romelia C Romelia C and Vasquez Martinez Wilmer S
Current Estimated Value
Purchase Details
Closed on
Sep 2, 2014
Sold by
Yesudhas Veeramani
Bought by
Vasquez Romelia C
Home Financials for this Owner
Home Financials are based on the most recent Mortgage that was taken out on this home.
Original Mortgage
$193,325
Interest Rate
3.87%
Mortgage Type
FHA
Purchase Details
Closed on
Feb 22, 2011
Sold by
Ruiz Rosa A
Bought by
Veeramani Yesudhas
Home Financials for this Owner
Home Financials are based on the most recent Mortgage that was taken out on this home.
Original Mortgage
$146,197
Interest Rate
5.25%
Mortgage Type
FHA
Purchase Details
Closed on
May 3, 2007
Sold by
Abdeen Nureldin
Bought by
Ruiz Rosa
Home Financials for this Owner
Home Financials are based on the most recent Mortgage that was taken out on this home.
Original Mortgage
$228,000
Interest Rate
6.23%
Mortgage Type
New Conventional
Create a Home Valuation Report for This Property
The Home Valuation Report is an in-depth analysis detailing your home's value as well as a comparison with similar homes in the area
Home Values in the Area
Average Home Value in this Area
Purchase History
| Date | Buyer | Sale Price | Title Company |
|---|---|---|---|
| Vasquez Vasquez Romelia C Romelia C | -- | None Available | |
| Vasquez Romelia C | $200,000 | -- | |
| Veeramani Yesudhas | $150,000 | -- | |
| Ruiz Rosa | $285,000 | -- |
Source: Public Records
Mortgage History
| Date | Status | Borrower | Loan Amount |
|---|---|---|---|
| Previous Owner | Vasquez Romelia C | $193,325 | |
| Previous Owner | Veeramani Yesudhas | $146,197 | |
| Previous Owner | Ruiz Rosa | $228,000 |
Source: Public Records
Tax History Compared to Growth
Tax History
| Year | Tax Paid | Tax Assessment Tax Assessment Total Assessment is a certain percentage of the fair market value that is determined by local assessors to be the total taxable value of land and additions on the property. | Land | Improvement |
|---|---|---|---|---|
| 2025 | $3,046 | $378,340 | $125,000 | $253,340 |
| 2024 | $3,026 | $349,830 | $125,000 | $224,830 |
| 2023 | $3,164 | $361,610 | $125,000 | $236,610 |
| 2022 | $3,022 | $339,590 | $120,000 | $219,590 |
| 2021 | $2,997 | $305,770 | $115,000 | $190,770 |
| 2020 | $2,923 | $282,450 | $100,000 | $182,450 |
| 2019 | $2,858 | $273,450 | $90,000 | $183,450 |
| 2018 | $2,860 | $263,620 | $90,000 | $173,620 |
| 2017 | $2,790 | $248,040 | $90,000 | $158,040 |
| 2016 | $2,676 | $233,670 | $0 | $0 |
| 2015 | $2,425 | $123,690 | $0 | $123,690 |
| 2014 | $2,313 | $115,270 | $0 | $115,270 |
Source: Public Records
Map
Nearby Homes
- 801 S Concord Ct
- 400 E Poplar Rd
- 100 W Poplar Rd
- 314 E Staunton Ave
- 1002 S Buckingham Rd
- 309 Williamsburg Rd
- 1050 Ramsgate Ct Unit C
- 706 S Dogwood Ct
- 1072 Norwood Ct
- 1114 S Dickenson Ave
- 920 Windsor Ct
- 1030 Salisbury Ct
- 346 Lancaster Square
- 1034 Salisbury Ct
- 801 S Filbert Ct
- 1049A Margate Ct
- 1006 S Greenthorn Ave
- 1048A Brixton Ct
- 1048A Margate Ct
- 1044 Brixton Ct Unit B
- 806 S Concord Ct
- 802 S Concord Ct
- 808 S Concord Ct
- 800 S Concord Ct
- 810 S Concord Ct
- 812 S Concord Ct
- 814 S Concord Ct
- 812 Colonial Ave
- 810 Colonial Ave
- 814 Colonial Ave
- 808 Colonial Ave
- 816 S Concord Ct
- 806 Colonial Ave
- 805 S Concord Ct
- 803 S Concord Ct
- 807 S Concord Ct
- 804 Colonial Ave
- 809 S Concord Ct
- 811 S Concord Ct
- 818 S Concord Ct