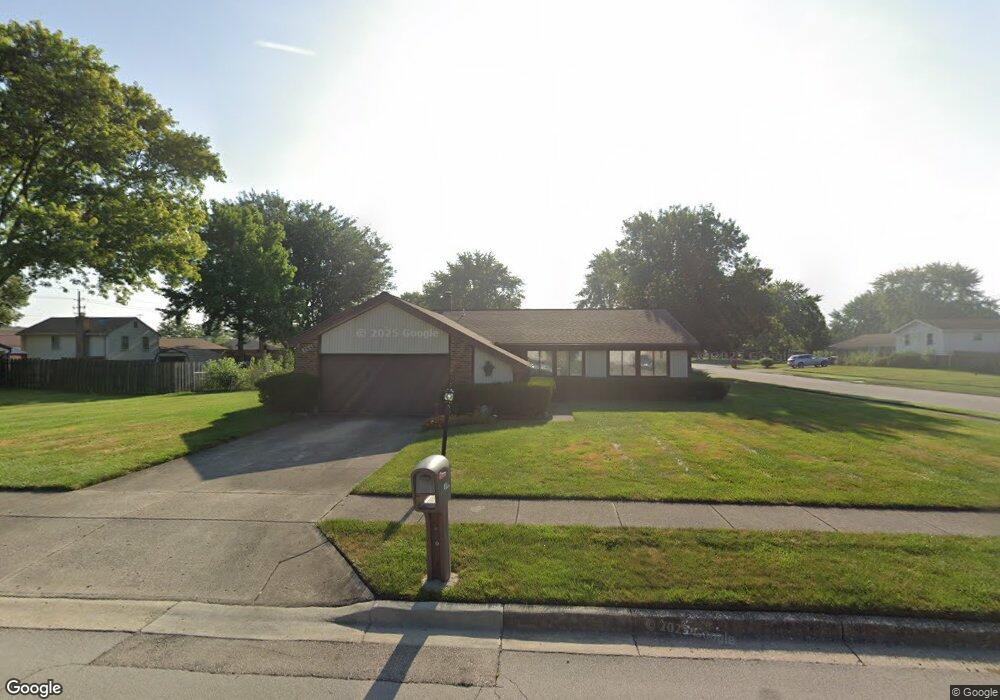
804 Southview Dr Englewood, OH 45322
Estimated Value: $236,000 - $241,756
3
Beds
2
Baths
1,670
Sq Ft
$143/Sq Ft
Est. Value
About This Home
This home is located at 804 Southview Dr, Englewood, OH 45322 and is currently estimated at $238,585, approximately $142 per square foot. 804 Southview Dr is a home located in Montgomery County with nearby schools including Englewood Hills Elementary School, Northmont High School, and Trotwood Preparatory & Fitness Academy.
Ownership History
Date
Name
Owned For
Owner Type
Purchase Details
Closed on
Jun 2, 2017
Sold by
Estate Of Helen Theressa Muchnock
Bought by
Muchnok Judith Ann and Kacmar Cynthia Joan
Current Estimated Value
Home Financials for this Owner
Home Financials are based on the most recent Mortgage that was taken out on this home.
Original Mortgage
$4,500
Interest Rate
3.94%
Mortgage Type
New Conventional
Purchase Details
Closed on
May 8, 2017
Sold by
Nemchik Lorranie Susan
Bought by
Muchnok Judith Ann
Home Financials for this Owner
Home Financials are based on the most recent Mortgage that was taken out on this home.
Original Mortgage
$4,500
Interest Rate
3.94%
Mortgage Type
New Conventional
Purchase Details
Closed on
May 1, 2017
Sold by
Kacmar Cynthia Joan
Bought by
Muchnok Judith Ann
Home Financials for this Owner
Home Financials are based on the most recent Mortgage that was taken out on this home.
Original Mortgage
$4,500
Interest Rate
3.94%
Mortgage Type
New Conventional
Create a Home Valuation Report for This Property
The Home Valuation Report is an in-depth analysis detailing your home's value as well as a comparison with similar homes in the area
Home Values in the Area
Average Home Value in this Area
Purchase History
| Date | Buyer | Sale Price | Title Company |
|---|---|---|---|
| Muchnok Judith Ann | -- | None Available | |
| Muchnok Judith Ann | $38,400 | None Available | |
| Muchnok Judith Ann | $38,400 | None Available |
Source: Public Records
Mortgage History
| Date | Status | Borrower | Loan Amount |
|---|---|---|---|
| Previous Owner | Muchnok Judith Ann | $4,500 |
Source: Public Records
Tax History Compared to Growth
Tax History
| Year | Tax Paid | Tax Assessment Tax Assessment Total Assessment is a certain percentage of the fair market value that is determined by local assessors to be the total taxable value of land and additions on the property. | Land | Improvement |
|---|---|---|---|---|
| 2024 | $3,054 | $62,670 | $13,140 | $49,530 |
| 2023 | $3,054 | $62,670 | $13,140 | $49,530 |
| 2022 | $2,696 | $45,080 | $9,450 | $35,630 |
| 2021 | $2,704 | $45,080 | $9,450 | $35,630 |
| 2020 | $2,655 | $45,080 | $9,450 | $35,630 |
| 2019 | $2,535 | $39,860 | $8,650 | $31,210 |
| 2018 | $2,489 | $39,860 | $8,650 | $31,210 |
| 2017 | $3,161 | $39,860 | $8,650 | $31,210 |
| 2016 | $2,938 | $36,390 | $7,860 | $28,530 |
| 2015 | $2,046 | $36,390 | $7,860 | $28,530 |
| 2014 | $2,046 | $36,390 | $7,860 | $28,530 |
| 2012 | -- | $37,190 | $7,880 | $29,310 |
Source: Public Records
Map
Nearby Homes
- 900 Moonlight Dr
- 250 Winter Creek Ct
- 4245 W Wenger Rd
- 830 W Wenger Rd
- 881 Sunset Dr
- 206 Gardengrove Way
- 1003 Sunset Dr
- 306 Pauly Dr
- 534 Unger Ave
- 505 Durst Dr
- 1024 Meadow Thrush Dr
- 510 Rohr Ln
- 510 Lambert Ln
- 4030 Gateway Dr
- 1008 Merrywood Dr
- 4329 Gorman Ave
- 229 Brookwood Dr
- 206 Lodestone Dr
- 1010 Heathwood Dr
- 1017 Terracewood Dr
- 805 Sunset Dr
- 800 Southview Dr
- 880 W Wenger Rd
- 805 Southview Dr
- 800 Sunset Dr
- 809 Sunset Dr
- 809 Southview Dr
- 801 Southview Dr
- 804 Sunset Dr
- 804 Sunset Dr Unit 1D
- 870 W Wenger Rd
- 813 Sunset Dr
- 812 Southview Dr
- 813 Ridge Rd
- 2004 Northcreek Dr
- 2002 Northcreek Dr
- 860 W Wenger Rd
- 2006 Northcreek Dr
- 2000 Northcreek Dr
- 817 Sunset Dr