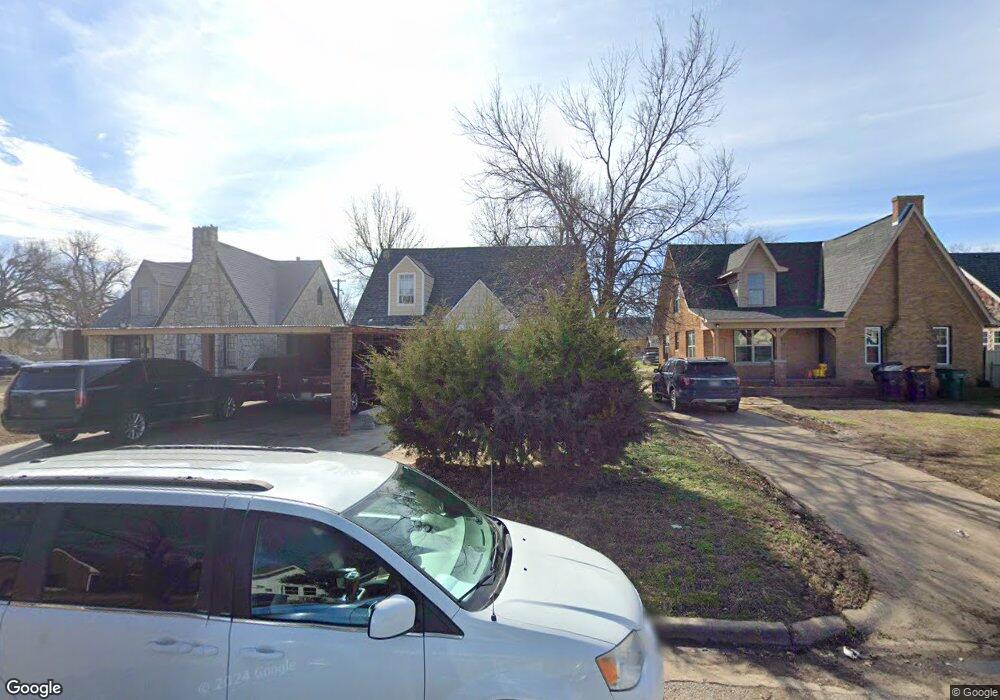
804 SW 35th St Oklahoma City, OK 73109
Capitol Hill NeighborhoodEstimated Value: $118,000 - $157,000
3
Beds
1
Bath
1,549
Sq Ft
$89/Sq Ft
Est. Value
About This Home
This home is located at 804 SW 35th St, Oklahoma City, OK 73109 and is currently estimated at $138,356, approximately $89 per square foot. 804 SW 35th St is a home located in Oklahoma County with nearby schools including Adelaide Lee Elementary School, Capitol Hill Middle School, and Capitol Hill High School.
Ownership History
Date
Name
Owned For
Owner Type
Purchase Details
Closed on
Jun 13, 2005
Sold by
Deutsche Bank National Trust Co
Bought by
Helping Kinney Enterprises Inc
Current Estimated Value
Purchase Details
Closed on
Feb 8, 2005
Sold by
Foster Monty and Foster Courtney
Bought by
Deutsche Bank National Trust Co and Ameriquest Mtg Securities Inc Asset Back
Purchase Details
Closed on
Oct 24, 2001
Sold by
Northern Intercorp Inc
Bought by
Foster Monty
Purchase Details
Closed on
Jan 7, 2000
Sold by
Reality Homes Inc
Bought by
Perez Antonio and Saldivar Iris
Home Financials for this Owner
Home Financials are based on the most recent Mortgage that was taken out on this home.
Original Mortgage
$42,750
Interest Rate
8.16%
Mortgage Type
Seller Take Back
Purchase Details
Closed on
Oct 27, 1998
Sold by
Livingston Mark C and Livingston Danette Lorie
Bought by
Northern Intercorp Inc
Create a Home Valuation Report for This Property
The Home Valuation Report is an in-depth analysis detailing your home's value as well as a comparison with similar homes in the area
Home Values in the Area
Average Home Value in this Area
Purchase History
| Date | Buyer | Sale Price | Title Company |
|---|---|---|---|
| Helping Kinney Enterprises Inc | $36,500 | Oklahoma City Abstract & Tit | |
| Deutsche Bank National Trust Co | -- | -- | |
| Foster Monty | $61,000 | Oklahoma City Abstract & Tit | |
| Perez Antonio | $47,500 | -- | |
| Northern Intercorp Inc | $17,500 | -- |
Source: Public Records
Mortgage History
| Date | Status | Borrower | Loan Amount |
|---|---|---|---|
| Previous Owner | Perez Antonio | $42,750 |
Source: Public Records
Tax History Compared to Growth
Tax History
| Year | Tax Paid | Tax Assessment Tax Assessment Total Assessment is a certain percentage of the fair market value that is determined by local assessors to be the total taxable value of land and additions on the property. | Land | Improvement |
|---|---|---|---|---|
| 2024 | $1,428 | $12,672 | $1,866 | $10,806 |
| 2023 | $1,428 | $12,069 | $1,985 | $10,084 |
| 2022 | $1,295 | $11,495 | $2,080 | $9,415 |
| 2021 | $972 | $8,658 | $986 | $7,672 |
| 2020 | $934 | $8,246 | $1,071 | $7,175 |
| 2019 | $886 | $7,854 | $1,006 | $6,848 |
| 2018 | $847 | $7,480 | $0 | $0 |
| 2017 | $821 | $7,259 | $1,036 | $6,223 |
| 2016 | $818 | $7,227 | $1,031 | $6,196 |
| 2015 | $787 | $6,883 | $1,034 | $5,849 |
| 2014 | $745 | $6,555 | $1,026 | $5,529 |
Source: Public Records
Map
Nearby Homes
- 617 SW 35th St
- 325 SW 40th St
- 1033 SW Binkley St
- 3225 S Douglas Ave
- 1128 SW Grand Blvd
- 607 SW 31st St
- 1116 SW 38th St
- 8 SW 41st St
- 520 SW 31st St
- 1141 SW Binkley St
- 115 SW 28th St
- 1028 SW 28th St
- 4406 S Olie Ave
- 505 SW 30th St
- 628 SW 43rd St
- 4312 S Lee Ave
- 1134 SW 42nd St
- 624 SW 44th St
- 3215 S Harvey Ave
- 400 SW 42nd St
- 808 SW 35th St
- 800 SW 35th St
- 812 SW 35th St
- 816 SW 35th St
- 744 SW 35th St
- 811 SW Grand Blvd
- 801 SW Grand Blvd
- 820 SW 35th St
- 815 SW Grand Blvd
- 805 SW 35th St
- 809 SW 35th St
- 801 SW 35th St
- 740 SW 35th St
- 813 SW 35th St
- 817 SW Grand Blvd
- 824 SW 35th St
- 821 SW 35th St
- 821 SW Grand Blvd
- 736 SW 35th St
- 745 SW 35th St