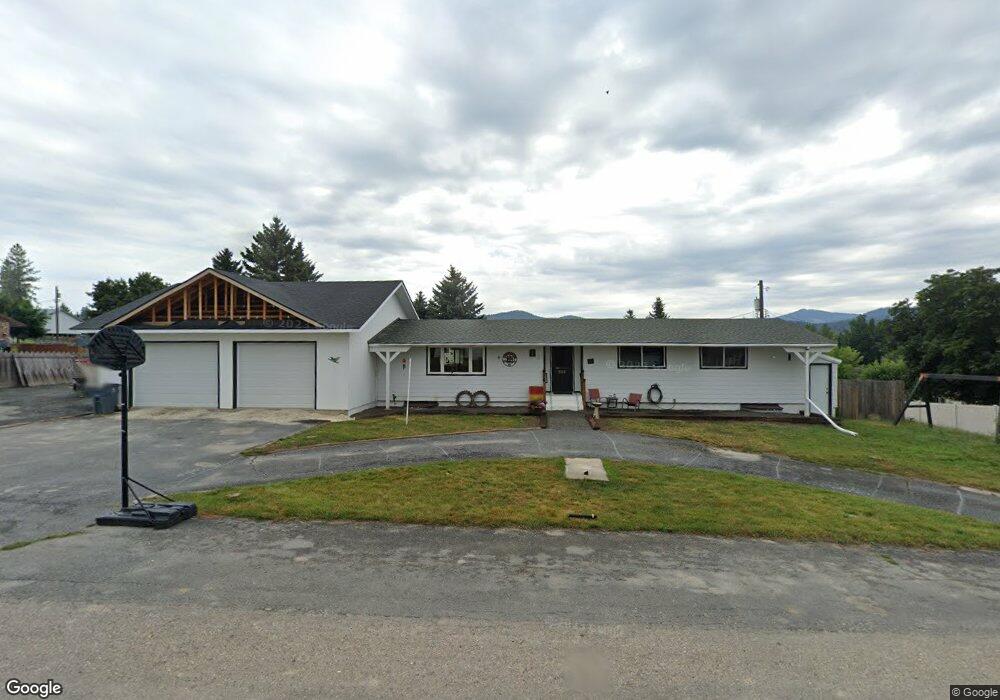
804 W Franklin Ave Chewelah, WA 99109
Estimated Value: $369,000 - $478,000
3
Beds
2
Baths
2,728
Sq Ft
$150/Sq Ft
Est. Value
About This Home
This home is located at 804 W Franklin Ave, Chewelah, WA 99109 and is currently estimated at $408,595, approximately $149 per square foot. 804 W Franklin Ave is a home located in Stevens County with nearby schools including Gess Elementary School and Jenkins Junior/Senior High School.
Ownership History
Date
Name
Owned For
Owner Type
Purchase Details
Closed on
Jul 30, 2021
Sold by
Alby David R and Alby Nicole
Bought by
Miller Shawn R and Miller Ashton M
Current Estimated Value
Home Financials for this Owner
Home Financials are based on the most recent Mortgage that was taken out on this home.
Original Mortgage
$270,750
Outstanding Balance
$246,306
Interest Rate
2.93%
Mortgage Type
New Conventional
Estimated Equity
$162,289
Purchase Details
Closed on
Mar 19, 2010
Sold by
Alby Lacie and Garner Lacie
Bought by
Alby David R
Purchase Details
Closed on
Apr 18, 2005
Sold by
Compton William A and The Compton Family Revocable T
Bought by
Alby David R
Home Financials for this Owner
Home Financials are based on the most recent Mortgage that was taken out on this home.
Original Mortgage
$74,160
Interest Rate
6.62%
Mortgage Type
Adjustable Rate Mortgage/ARM
Create a Home Valuation Report for This Property
The Home Valuation Report is an in-depth analysis detailing your home's value as well as a comparison with similar homes in the area
Home Values in the Area
Average Home Value in this Area
Purchase History
| Date | Buyer | Sale Price | Title Company |
|---|---|---|---|
| Miller Shawn R | $285,000 | Stevens County Title Company | |
| Alby David R | -- | Stevens County Title Company | |
| Alby David R | $92,700 | Stevens County Title Company |
Source: Public Records
Mortgage History
| Date | Status | Borrower | Loan Amount |
|---|---|---|---|
| Open | Miller Shawn R | $270,750 | |
| Previous Owner | Alby David R | $74,160 |
Source: Public Records
Tax History Compared to Growth
Tax History
| Year | Tax Paid | Tax Assessment Tax Assessment Total Assessment is a certain percentage of the fair market value that is determined by local assessors to be the total taxable value of land and additions on the property. | Land | Improvement |
|---|---|---|---|---|
| 2024 | $2,813 | $412,356 | $45,000 | $367,356 |
| 2023 | $2,429 | $351,868 | $29,870 | $321,998 |
| 2022 | $2,134 | $284,696 | $29,250 | $255,446 |
| 2021 | $1,466 | $167,911 | $22,500 | $145,411 |
| 2020 | $1,464 | $167,911 | $22,500 | $145,411 |
| 2019 | $1,298 | $155,805 | $25,000 | $130,805 |
| 2018 | $1,386 | $143,173 | $25,000 | $118,173 |
| 2017 | $1,176 | $138,525 | $18,750 | $119,775 |
| 2016 | $1,105 | $126,548 | $18,750 | $107,798 |
| 2015 | -- | $126,548 | $18,750 | $107,798 |
| 2013 | -- | $138,525 | $18,750 | $119,775 |
Source: Public Records
Map
Nearby Homes
- 902 N West St
- 813 Tamarack Ln
- 708 N Ridge St
- 604 N West St
- XXX Pinebrook Dr
- 906 Valley Ave
- 604 N 3rd St W
- 206 W Jenkins Ave
- 000 Pinebrook Dr
- 1006 W Clay Ave
- 104 -106 N Ridge St
- 104 -106 N Ridge St
- 104 N Ridge St
- 104 & 106 N Ridge St
- 101/915 W West Main Ave
- 1005 N 3rd St E
- 602 W King St
- 602 W King Ave
- 208 W Main Ave
- 903 W King Ave
- 802 N Bernard St
- 800 W Franklin Ave
- 804 N Bernard St
- 710 N Bernard St
- 803 W Franklin Ave
- 902 W Franklin Ave
- 801 N Victoria St
- 801 N Bernard St
- 707 N Bernard St
- 805 N Bernard St
- 903 W Franklin Ave
- 808 N Bernard St
- 807 N Bernard St
- 808 W Jenkins Ave
- 806 W Jenkins Ave
- 804 W Jenkins Ave
- 819 N West St
- 908 W Franklin Ave
- 800 N Victoria St
- 802 N West St