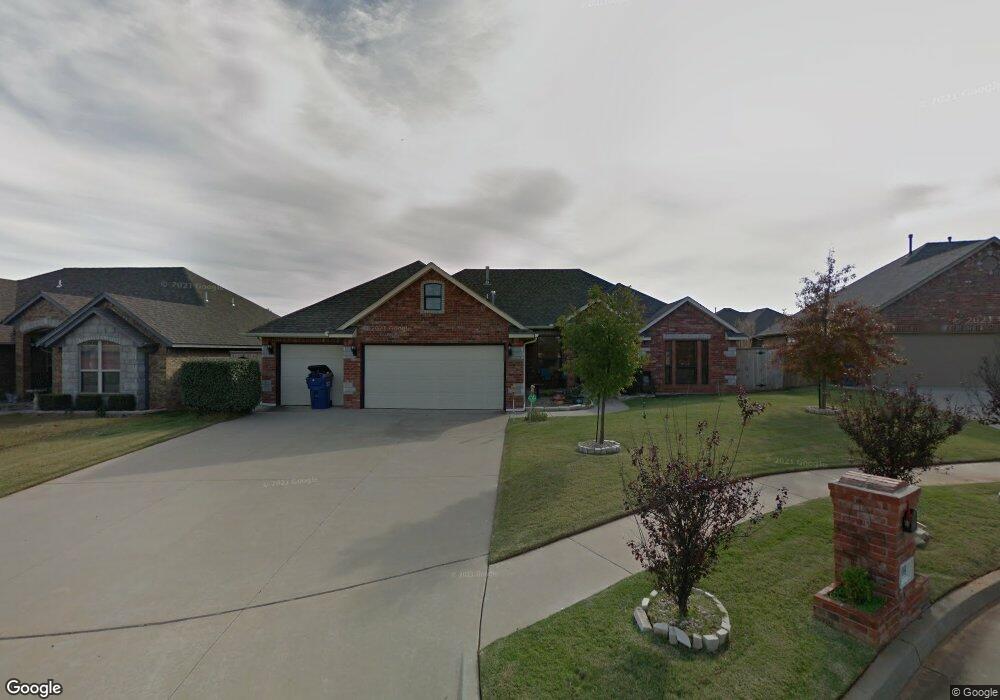
804 W Windmill Ct Mustang, OK 73064
Estimated Value: $306,866 - $341,000
4
Beds
2
Baths
2,294
Sq Ft
$142/Sq Ft
Est. Value
About This Home
This home is located at 804 W Windmill Ct, Mustang, OK 73064 and is currently estimated at $325,717, approximately $141 per square foot. 804 W Windmill Ct is a home located in Canadian County with nearby schools including Mustang Centennial Elementary School, Mustang Horizon Intermediate School, and Mustang Middle School.
Ownership History
Date
Name
Owned For
Owner Type
Purchase Details
Closed on
May 3, 2012
Sold by
Eddingfield Kim
Bought by
Azaroff Stephen and Azaroff Kelly
Current Estimated Value
Home Financials for this Owner
Home Financials are based on the most recent Mortgage that was taken out on this home.
Original Mortgage
$205,000
Outstanding Balance
$143,425
Interest Rate
4.11%
Estimated Equity
$182,292
Purchase Details
Closed on
Jun 24, 2005
Sold by
Md Merryfield Inc
Bought by
Eddingfield Kim
Home Financials for this Owner
Home Financials are based on the most recent Mortgage that was taken out on this home.
Original Mortgage
$216,229
Interest Rate
5.63%
Purchase Details
Closed on
Nov 22, 2004
Sold by
M & O Enterprises Llc
Home Financials for this Owner
Home Financials are based on the most recent Mortgage that was taken out on this home.
Original Mortgage
$464,800
Interest Rate
5.7%
Create a Home Valuation Report for This Property
The Home Valuation Report is an in-depth analysis detailing your home's value as well as a comparison with similar homes in the area
Home Values in the Area
Average Home Value in this Area
Purchase History
| Date | Buyer | Sale Price | Title Company |
|---|---|---|---|
| Azaroff Stephen | $205,000 | Ort | |
| Eddingfield Kim | $162,375 | None Available | |
| -- | -- | -- |
Source: Public Records
Mortgage History
| Date | Status | Borrower | Loan Amount |
|---|---|---|---|
| Open | Azaroff Stephen | $205,000 | |
| Previous Owner | Eddingfield Kim | $216,229 | |
| Previous Owner | -- | $464,800 |
Source: Public Records
Tax History Compared to Growth
Tax History
| Year | Tax Paid | Tax Assessment Tax Assessment Total Assessment is a certain percentage of the fair market value that is determined by local assessors to be the total taxable value of land and additions on the property. | Land | Improvement |
|---|---|---|---|---|
| 2024 | $2,596 | $27,831 | $2,880 | $24,951 |
| 2023 | $2,596 | $27,021 | $2,880 | $24,141 |
| 2022 | $2,548 | $26,234 | $2,880 | $23,354 |
| 2021 | $2,481 | $25,470 | $2,880 | $22,590 |
| 2020 | $2,523 | $25,733 | $2,880 | $22,853 |
| 2019 | $2,489 | $25,400 | $2,880 | $22,520 |
| 2018 | $2,466 | $24,660 | $2,880 | $21,780 |
| 2017 | $2,364 | $23,942 | $2,880 | $21,062 |
| 2016 | $2,488 | $25,849 | $2,880 | $22,969 |
| 2015 | $2,626 | $24,365 | $2,880 | $21,485 |
| 2014 | $2,626 | $26,289 | $2,880 | $23,409 |
Source: Public Records
Map
Nearby Homes
- 608 N Remington Way
- 1005 W Ridgehaven Way
- 900 W Nandina Way
- 508 N Caddell Way
- 601 N Chisholm Trail Way
- 1250 N Tea Olive Way
- 1408 N Golden Bell Way
- 1035 W Windsor Way
- 1208 W Flowering Peach Way
- 628 W Alamo Court Way
- 602 W Shadow Ridge Way
- 531 W Shadow Ridge Way
- 1308 W Harvard Way
- 513 N Shannon Way
- 1316 W Harvard Way
- 313 N Shannon Way
- 1401 W Harvard Way
- 413 W Pines Way
- 5813 Tiger Stone Dr
- 400 N Amethyst Way
- 800 W Windmill Ct
- 808 W Windmill Ct
- 805 W Prairie Way
- 768 W Windmill Ct
- 801 W Prairie Way
- 809 W Prairie Way
- 812 W Windmill Ct
- 769 W Prairie Way
- 801 W Windmill Ct
- 813 W Prairie Way
- 813 W Windmill Ct
- 764 W Windmill Ct
- 805 W Windmill Ct
- 809 W Windmill Ct
- 769 W Windmill Ct
- 765 W Prairie Way
- 912 N Barn Hill Way
- 916 N Barn Hill Way
- 908 N Barn Hill Way
- 1000 N Barn Hill Way