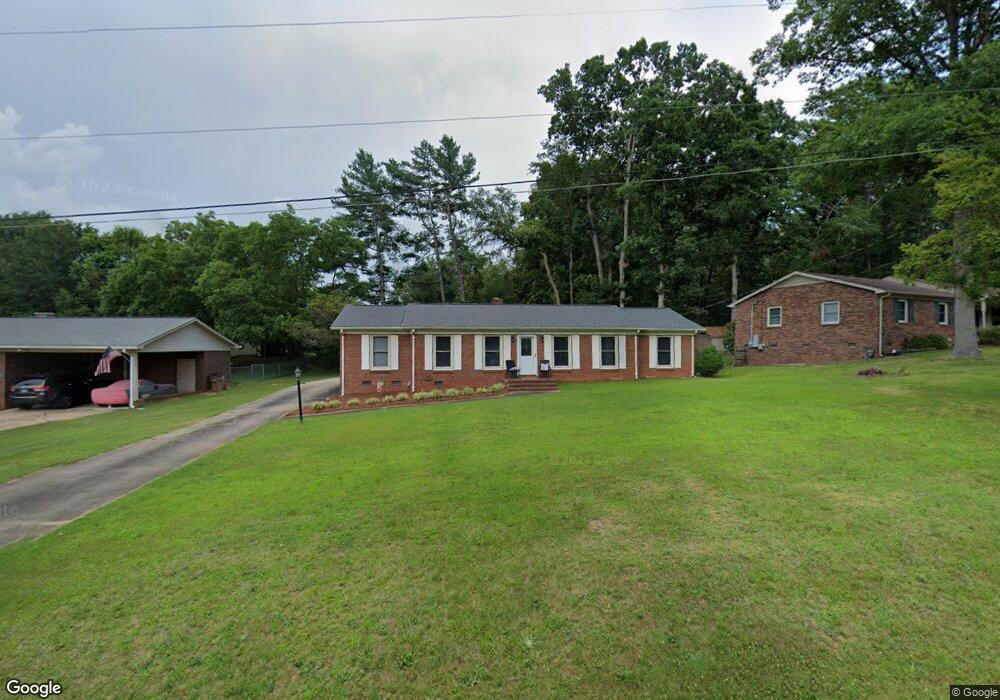
804 Waters St Shelby, NC 28152
Estimated Value: $214,939 - $314,000
3
Beds
2
Baths
1,075
Sq Ft
$236/Sq Ft
Est. Value
About This Home
This home is located at 804 Waters St, Shelby, NC 28152 and is currently estimated at $253,735, approximately $236 per square foot. 804 Waters St is a home located in Cleveland County with nearby schools including James Love Elementary School, Shelby Middle School, and Shelby High School.
Ownership History
Date
Name
Owned For
Owner Type
Purchase Details
Closed on
Aug 26, 2010
Sold by
Phifer John Michael
Bought by
Burgess James C and Burgess Takiyah
Current Estimated Value
Home Financials for this Owner
Home Financials are based on the most recent Mortgage that was taken out on this home.
Original Mortgage
$108,163
Outstanding Balance
$72,037
Interest Rate
4.61%
Mortgage Type
FHA
Estimated Equity
$181,698
Purchase Details
Closed on
Feb 20, 2008
Sold by
Mclean Jeffrey N and Mclean Laury
Bought by
Phifer John Michael
Home Financials for this Owner
Home Financials are based on the most recent Mortgage that was taken out on this home.
Original Mortgage
$76,400
Interest Rate
5.65%
Mortgage Type
Purchase Money Mortgage
Create a Home Valuation Report for This Property
The Home Valuation Report is an in-depth analysis detailing your home's value as well as a comparison with similar homes in the area
Home Values in the Area
Average Home Value in this Area
Purchase History
| Date | Buyer | Sale Price | Title Company |
|---|---|---|---|
| Burgess James C | $111,000 | None Available | |
| Phifer John Michael | $95,500 | None Available |
Source: Public Records
Mortgage History
| Date | Status | Borrower | Loan Amount |
|---|---|---|---|
| Open | Burgess James C | $108,163 | |
| Previous Owner | Phifer John Michael | $76,400 |
Source: Public Records
Tax History Compared to Growth
Tax History
| Year | Tax Paid | Tax Assessment Tax Assessment Total Assessment is a certain percentage of the fair market value that is determined by local assessors to be the total taxable value of land and additions on the property. | Land | Improvement |
|---|---|---|---|---|
| 2025 | $1,938 | $194,776 | $13,677 | $181,099 |
| 2024 | $1,123 | $91,107 | $10,941 | $80,166 |
| 2023 | $1,117 | $91,107 | $10,941 | $80,166 |
| 2022 | $1,117 | $91,107 | $10,941 | $80,166 |
| 2021 | $1,123 | $91,107 | $10,941 | $80,166 |
| 2020 | $1,075 | $84,783 | $10,941 | $73,842 |
| 2019 | $1,075 | $84,783 | $10,941 | $73,842 |
| 2018 | $1,074 | $84,783 | $10,941 | $73,842 |
| 2017 | $1,048 | $84,783 | $10,941 | $73,842 |
| 2016 | $1,051 | $84,783 | $10,941 | $73,842 |
| 2015 | $1,097 | $93,372 | $10,941 | $82,431 |
| 2014 | $1,097 | $93,372 | $10,941 | $82,431 |
Source: Public Records
Map
Nearby Homes
- 1511 Farm Rd
- 607 Blythe St
- 712 Maynard St
- 1401 Woodman Hall St
- 308 James Love School Rd
- 901 Linney Ln
- 112 Holly Hill Rd
- 905a Linney Ln
- 900 Linney Ln
- 404 James Love School Rd
- 800 Charles Rd
- 814 Rhodann Dr
- 1241 S Lafayette St
- 111 Morton St
- 1620 Mcfarland Dr
- 1303 Hunt St
- 1311 Dockery Dr
- 804 Broad St
- 1104 Silver St
- 1313 Dockery Dr Unit 1
- 802 Waters St
- 806 Waters St
- 1422 S Ridge St
- 805 Waters St
- 808 Waters St
- 803 Waters St
- 1406 Southridge St Unit 4
- 1408 Southridge St Unit 5
- 1410 Southridge St Unit 6
- 1414 Southridge St Unit 8
- 807 Waters St
- 801 Waters St
- 1425 S Ridge St
- 809 Waters St
- 1431 S Ridge St
- 810 Waters St
- 806 Hill St
- 808 Hill St
- 1421 Southridge St
- 811 Waters St