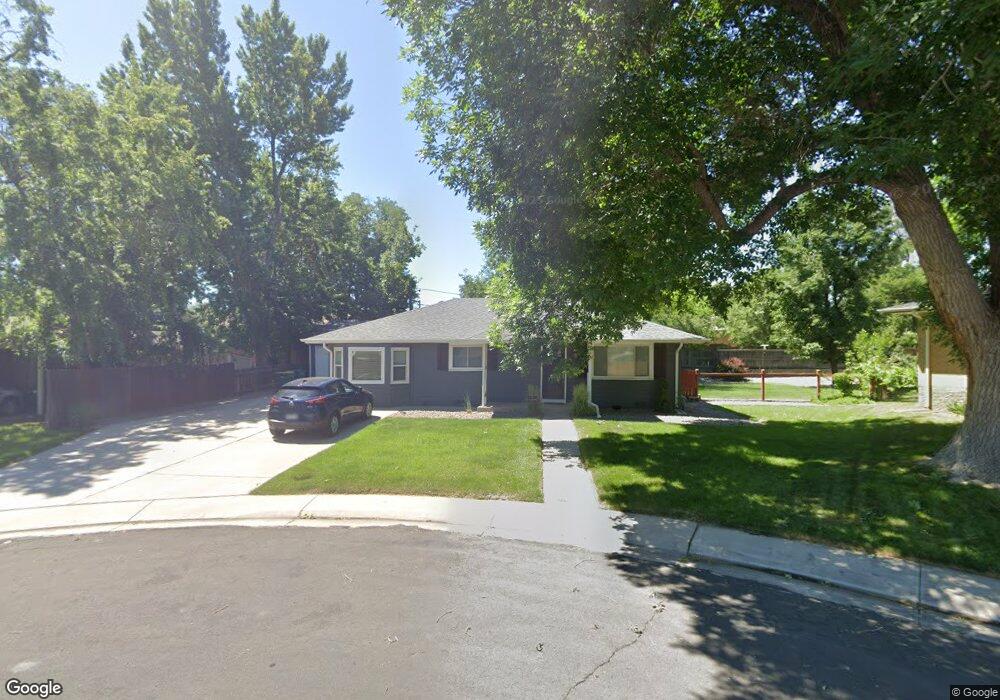
8040 W 45th Ave Wheat Ridge, CO 80033
Bel Aire NeighborhoodEstimated Value: $558,000 - $632,000
3
Beds
2
Baths
1,204
Sq Ft
$499/Sq Ft
Est. Value
About This Home
This home is located at 8040 W 45th Ave, Wheat Ridge, CO 80033 and is currently estimated at $601,042, approximately $499 per square foot. 8040 W 45th Ave is a home located in Jefferson County with nearby schools including Stevens Elementary School, Everitt Middle School, and Wheat Ridge High School.
Ownership History
Date
Name
Owned For
Owner Type
Purchase Details
Closed on
Sep 2, 2020
Sold by
Lopez John P
Bought by
Big Dog 2 Llc
Current Estimated Value
Purchase Details
Closed on
Jul 20, 2015
Sold by
Carrera Edmund R
Bought by
Lopez John P
Home Financials for this Owner
Home Financials are based on the most recent Mortgage that was taken out on this home.
Original Mortgage
$257,000
Interest Rate
4.08%
Mortgage Type
New Conventional
Purchase Details
Closed on
Feb 7, 2014
Sold by
Mcloughlin Molly L
Bought by
Carrera Edmund R
Purchase Details
Closed on
Dec 15, 2003
Sold by
Raley Lynette E
Bought by
Mcloughlin Molly L
Home Financials for this Owner
Home Financials are based on the most recent Mortgage that was taken out on this home.
Original Mortgage
$165,394
Interest Rate
5.97%
Mortgage Type
FHA
Purchase Details
Closed on
May 30, 2001
Sold by
Leterneau Elizabeth M and Graul Elizabeth H
Bought by
Raley Lynette E
Create a Home Valuation Report for This Property
The Home Valuation Report is an in-depth analysis detailing your home's value as well as a comparison with similar homes in the area
Home Values in the Area
Average Home Value in this Area
Purchase History
| Date | Buyer | Sale Price | Title Company |
|---|---|---|---|
| Big Dog 2 Llc | $480,000 | Equitable Title Agency Llc | |
| Lopez John P | $319,000 | Prestige Escrow & Title | |
| Carrera Edmund R | $267,000 | Homestead Title & Escrow | |
| Mcloughlin Molly L | $168,000 | Empire Title & Escrow | |
| Raley Lynette E | -- | -- |
Source: Public Records
Mortgage History
| Date | Status | Borrower | Loan Amount |
|---|---|---|---|
| Previous Owner | Lopez John P | $257,000 | |
| Previous Owner | Mcloughlin Molly L | $165,394 |
Source: Public Records
Tax History Compared to Growth
Tax History
| Year | Tax Paid | Tax Assessment Tax Assessment Total Assessment is a certain percentage of the fair market value that is determined by local assessors to be the total taxable value of land and additions on the property. | Land | Improvement |
|---|---|---|---|---|
| 2024 | $3,180 | $36,368 | $20,295 | $16,073 |
| 2023 | $3,180 | $36,368 | $20,295 | $16,073 |
| 2022 | $2,568 | $28,842 | $14,058 | $14,784 |
| 2021 | $2,603 | $29,671 | $14,462 | $15,209 |
| 2020 | $2,418 | $27,699 | $14,032 | $13,667 |
| 2019 | $2,386 | $27,699 | $14,032 | $13,667 |
| 2018 | $2,057 | $23,080 | $8,366 | $14,714 |
| 2017 | $1,857 | $23,080 | $8,366 | $14,714 |
| 2016 | $1,747 | $20,311 | $6,580 | $13,731 |
| 2015 | $1,380 | $20,311 | $6,580 | $13,731 |
| 2014 | $1,380 | $15,060 | $5,158 | $9,902 |
Source: Public Records
Map
Nearby Homes
- 4675 Balsam St
- 7808 W 43rd Place
- 8530 W 46th Ave
- 4105 Yarrow Ct
- 4711 Wadsworth Blvd
- 4787 Carr St
- 4785 Carr St
- 8748 W 46th Ave
- 4752 Dover St
- 3905 Balsam St
- 7505 W 47th Ave
- 4744 Dudley St
- 7801 W 39th Ave
- 4563 Everett St
- 4420 Teller St
- 4635 Teller St
- 8553 W 48th Place
- 8976 W 46th Place Unit 8976
- 7010 W 44th Ave
- 4541 Reed St
- 8060 W 45th Ave
- 8045 W 44th Place
- 8025 W 44th Place
- 8055 W 44th Place
- 8065 W 45th Ave
- 8000 W 45th Ave
- 4500 Balsam St
- 8045 W 45th Ave
- 8025 W 45th Ave
- 8005 W 44th Place
- 4480 Balsam St
- 4510 Balsam St
- 8040 W 44th Place
- 8005 W 45th Ave
- 4470 Balsam St
- 4520 Balsam St
- 8040 W 45th Place
- 8030 W 44th Place
- 8020 W 44th Place
- 8020 W 45th Place