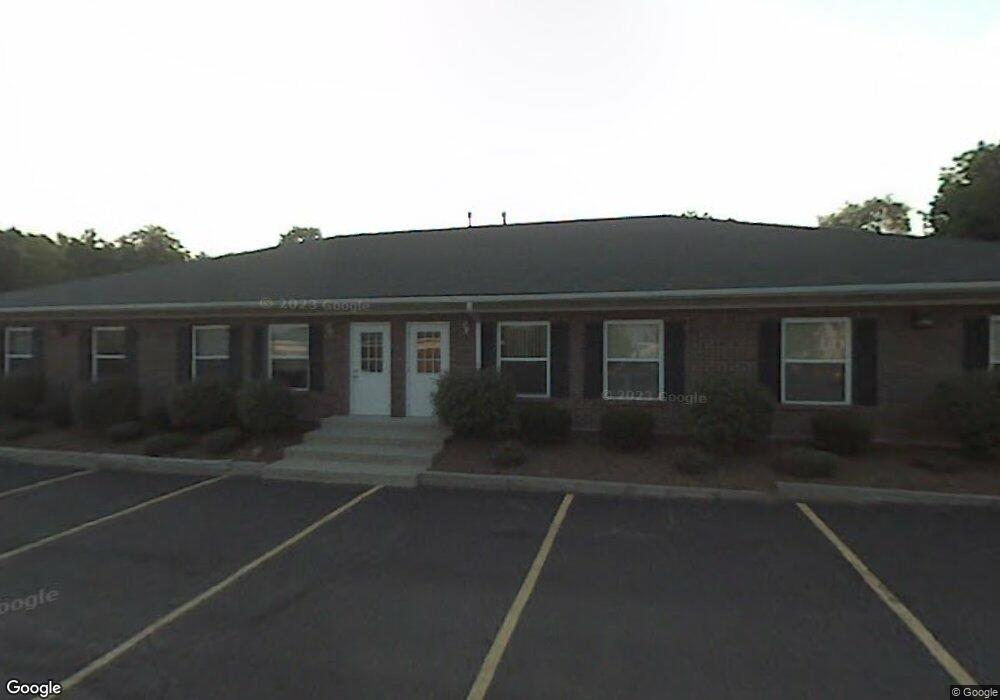
8043 Corporate Cir Unit SUITE North Royalton, OH 44133
Estimated Value: $334,074
--
Bed
--
Bath
1,000
Sq Ft
$334/Sq Ft
Est. Value
About This Home
This home is located at 8043 Corporate Cir Unit SUITE, North Royalton, OH 44133 and is currently estimated at $334,074, approximately $334 per square foot. 8043 Corporate Cir Unit SUITE is a home located in Cuyahoga County with nearby schools including North Royalton Middle School, North Royalton High School, and Bethel Christian Academy.
Ownership History
Date
Name
Owned For
Owner Type
Purchase Details
Closed on
Apr 28, 2025
Sold by
Ccc Properties Ltd
Bought by
Volodya Glory Llc
Current Estimated Value
Purchase Details
Closed on
May 5, 1995
Sold by
Iacobelli Mark A
Bought by
Ccc Properties Ltd Liability Co
Home Financials for this Owner
Home Financials are based on the most recent Mortgage that was taken out on this home.
Original Mortgage
$80,406
Interest Rate
8.43%
Mortgage Type
Commercial
Purchase Details
Closed on
Aug 28, 1990
Bought by
Iacobelli Mark A Dds
Purchase Details
Closed on
Jan 1, 1990
Bought by
Timber Ridge Plaza
Create a Home Valuation Report for This Property
The Home Valuation Report is an in-depth analysis detailing your home's value as well as a comparison with similar homes in the area
Home Values in the Area
Average Home Value in this Area
Purchase History
| Date | Buyer | Sale Price | Title Company |
|---|---|---|---|
| Volodya Glory Llc | $326,000 | Affiliates Title | |
| Ccc Properties Ltd Liability Co | $107,406 | -- | |
| Iacobelli Mark A Dds | $167,000 | -- | |
| Timber Ridge Plaza | -- | -- |
Source: Public Records
Mortgage History
| Date | Status | Borrower | Loan Amount |
|---|---|---|---|
| Previous Owner | Ccc Properties Ltd Liability Co | $80,406 |
Source: Public Records
Tax History Compared to Growth
Tax History
| Year | Tax Paid | Tax Assessment Tax Assessment Total Assessment is a certain percentage of the fair market value that is determined by local assessors to be the total taxable value of land and additions on the property. | Land | Improvement |
|---|---|---|---|---|
| 2024 | $7,217 | $102,060 | $8,260 | $93,800 |
| 2023 | $7,387 | $101,500 | $8,260 | $93,240 |
| 2022 | $7,365 | $101,500 | $8,260 | $93,240 |
| 2021 | $7,521 | $101,500 | $8,260 | $93,240 |
| 2020 | $7,689 | $101,500 | $8,260 | $93,240 |
| 2019 | $7,481 | $325,200 | $23,600 | $301,600 |
| 2018 | $7,803 | $113,820 | $8,260 | $105,560 |
| 2017 | $7,479 | $96,250 | $7,770 | $88,480 |
| 2016 | $7,125 | $96,250 | $7,770 | $88,480 |
| 2015 | $7,556 | $96,250 | $7,770 | $88,480 |
| 2014 | $7,556 | $102,380 | $8,260 | $94,120 |
Source: Public Records
Map
Nearby Homes
- 8414 York Rd
- 11000 W Sprague Rd
- 0 Tilby Rd
- 9680 Cedarwood Dr
- 9912 Lynn Dr
- 7957 Pamela Dr
- 9841 Beechwood Dr
- 8400 Vista Ln
- 9901 Beechwood Dr
- 10821 Gregory Ln
- 8960 Wildwood Dr
- 8007 Sierra Oval
- 9616 W Pleasant Valley Rd
- 11339 Gordon Dr
- 11228 Gordon Dr
- 10641 Albion Rd
- 8963 Abbey Rd
- 9433 Abbey Rd
- 12658 Gardenside Dr
- 12631 Pinebrook Dr
- 8043 Corporate Cir Unit 4
- 8043 Corporate Cir Unit 3
- 8040 Corporate Cir Unit 4
- 8040 Corporate Cir Unit Suite
- 8040 Corporate Cir Unit 2
- 8040 Corporate Cir Unit 3
- 8040 Corporate Cir
- 8040 Corporate Suite #2 Cir
- 8050 Corporate Cir Unit 2 up
- 8050 Corporate Cir Unit 6
- 8050 Corporate Cir Unit 5
- 8050 Corporate Cir
- 8025 Corporate Cir
- 8050 Timber Ridge Dr
- 8000 Timber Ridge Dr
- 8100 Timber Ridge Dr
- 9530 Rainbow Ln
- 7950 Timber Ridge Dr
- 8150 Ripley Rd
- 9520 Rainbow Ln