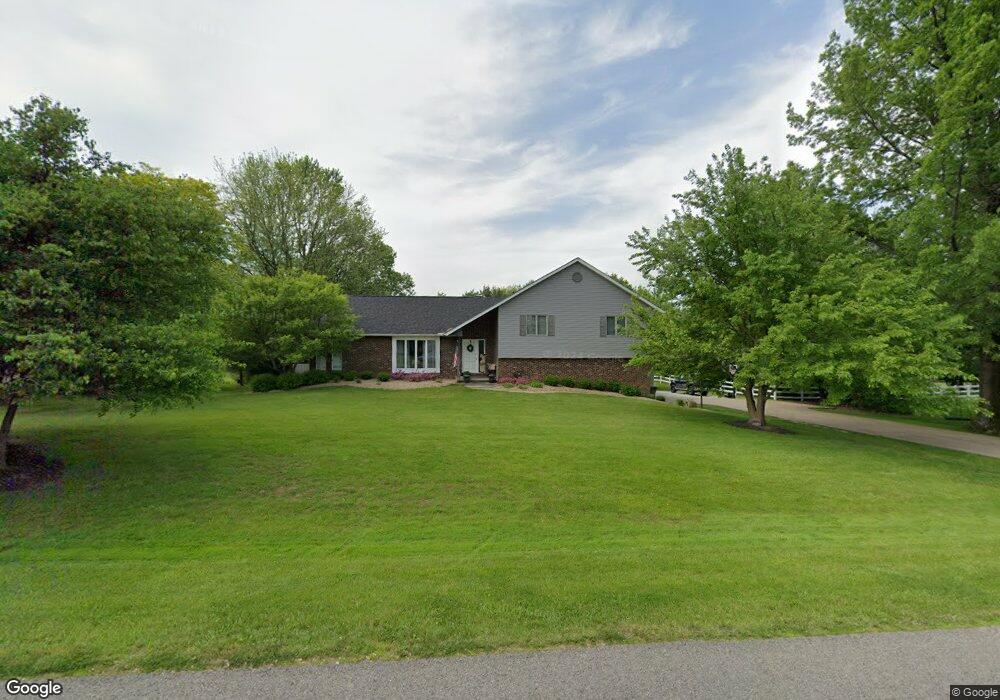
8043 W Ohio State Ln NW Lancaster, OH 43130
Bloom NeighborhoodEstimated Value: $426,205 - $546,000
3
Beds
3
Baths
2,836
Sq Ft
$168/Sq Ft
Est. Value
About This Home
This home is located at 8043 W Ohio State Ln NW, Lancaster, OH 43130 and is currently estimated at $475,551, approximately $167 per square foot. 8043 W Ohio State Ln NW is a home located in Fairfield County with nearby schools including Bloom Carroll Primary School, Bloom Carroll Intermediate School, and Bloom-Carroll Middle School.
Ownership History
Date
Name
Owned For
Owner Type
Purchase Details
Closed on
Jun 13, 2014
Sold by
Newton Albert A and Newton Tina A
Bought by
Bishop Bradley R and Bishop Jodi
Current Estimated Value
Home Financials for this Owner
Home Financials are based on the most recent Mortgage that was taken out on this home.
Original Mortgage
$22,900
Interest Rate
4.11%
Mortgage Type
Credit Line Revolving
Purchase Details
Closed on
May 25, 2007
Sold by
Bolte Michael A and Bolte Wanda
Bought by
Newton Albert A and Newton Tina A
Home Financials for this Owner
Home Financials are based on the most recent Mortgage that was taken out on this home.
Original Mortgage
$179,920
Interest Rate
6.22%
Mortgage Type
Purchase Money Mortgage
Create a Home Valuation Report for This Property
The Home Valuation Report is an in-depth analysis detailing your home's value as well as a comparison with similar homes in the area
Home Values in the Area
Average Home Value in this Area
Purchase History
| Date | Buyer | Sale Price | Title Company |
|---|---|---|---|
| Bishop Bradley R | $229,000 | First Ohio Title Ins Box | |
| Newton Albert A | $224,900 | Attorney |
Source: Public Records
Mortgage History
| Date | Status | Borrower | Loan Amount |
|---|---|---|---|
| Closed | Bishop Bradley R | $22,900 | |
| Closed | Newton Albert A | $179,920 |
Source: Public Records
Tax History Compared to Growth
Tax History
| Year | Tax Paid | Tax Assessment Tax Assessment Total Assessment is a certain percentage of the fair market value that is determined by local assessors to be the total taxable value of land and additions on the property. | Land | Improvement |
|---|---|---|---|---|
| 2024 | $8,541 | $103,650 | $17,060 | $86,590 |
| 2023 | $4,397 | $101,460 | $17,060 | $84,400 |
| 2022 | $4,430 | $101,460 | $17,060 | $84,400 |
| 2021 | $3,947 | $81,730 | $15,100 | $66,630 |
| 2020 | $3,989 | $81,730 | $15,100 | $66,630 |
| 2019 | $4,001 | $81,730 | $15,100 | $66,630 |
| 2018 | $3,407 | $56,800 | $11,160 | $45,640 |
| 2017 | $3,216 | $70,300 | $11,160 | $59,140 |
| 2016 | $3,169 | $70,300 | $11,160 | $59,140 |
| 2015 | $3,013 | $64,980 | $11,160 | $53,820 |
| 2014 | $2,894 | $64,980 | $11,160 | $53,820 |
| 2013 | $2,894 | $64,980 | $11,160 | $53,820 |
Source: Public Records
Map
Nearby Homes
- 7835 E Ohio State Ln NW
- 8642 Water St
- 839 Rockmill Rd NW
- 9605 Royalton Rd SW
- 7985 Lithopolis Rd NW
- 1975 Lamb Rd NW
- 10 Mount Zion Rd NW
- 681 Mount Zion Rd SW
- 8485 Westfall Rd SW
- 8416 Royalton Rd SW
- 8245 Royalton Rd SW
- 8143 Royalton Rd SW
- 1219 W Slate Ridge Dr
- 2780 Cedar Hill Rd NW
- 5550 Westfall Rd SW
- 10385 Lithopolis Rd NW
- 8322 Benson Rd
- 00 Duncan Rd SW
- 11394 Cedar Creek Dr NW
- 4180 Stone Hill Drive East NW
- 8015 W Ohio State Ln NW
- 8045 W Ohio State Ln NW
- 8042 W Ohio State Ln NW
- 7975 E Ohio State Ln NW
- 8099 W Ohio State Ln NW
- 8014 W Ohio State Ln NW
- 8070 W Ohio State Ln NW
- 8042 W Bowling Green Ln NW
- 7968 E Ohio State Ln NW
- 8014 W Bowling Green Ln NW
- 8070 W Bowling Green Ln NW
- 8098 W Ohio State Ln NW
- 7945 E Ohio State Ln NW
- 8127 W Ohio State Ln NW
- 8098 W Bowling Green Ln NW
- 7940 E Ohio State Ln NW
- 7968 E Bowling Green Ln NW
- 8126 W Ohio State Ln NW
- 8126 W Bowling Green Ln NW
- 8155 W Ohio State Ln NW