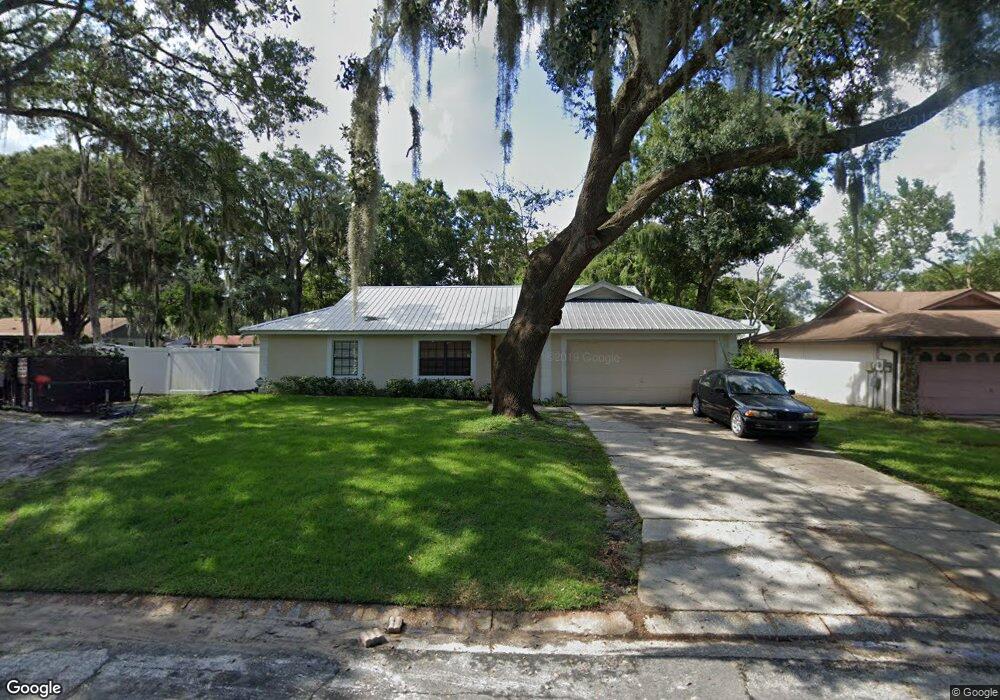
8044 Fawnridge Cir Unit 1 Tampa, FL 33610
East Lake-Orient Park NeighborhoodEstimated Value: $359,000 - $367,000
5
Beds
2
Baths
2,167
Sq Ft
$168/Sq Ft
Est. Value
About This Home
This home is located at 8044 Fawnridge Cir Unit 1, Tampa, FL 33610 and is currently estimated at $363,906, approximately $167 per square foot. 8044 Fawnridge Cir Unit 1 is a home located in Hillsborough County with nearby schools including Robles Elementary School, Jennings Middle School, and King High School.
Ownership History
Date
Name
Owned For
Owner Type
Purchase Details
Closed on
Sep 25, 2014
Sold by
Roberts Bobby Lee
Bought by
Chau Jan
Current Estimated Value
Purchase Details
Closed on
Oct 17, 2012
Sold by
He Hai Huan
Bought by
Chau Yan
Purchase Details
Closed on
Oct 11, 2011
Sold by
Chau Yan
Bought by
He Hai Huan
Purchase Details
Closed on
Jul 12, 2011
Sold by
Hsbc Mortgage Services Inc
Bought by
Chau Yan Y
Purchase Details
Closed on
Feb 1, 2011
Sold by
James David and James Tina
Bought by
Hsbc Mortgage Services Inc
Purchase Details
Closed on
Jul 15, 2004
Sold by
James David and James Tina
Bought by
James David and James Tina
Home Financials for this Owner
Home Financials are based on the most recent Mortgage that was taken out on this home.
Original Mortgage
$111,000
Interest Rate
7.99%
Mortgage Type
New Conventional
Create a Home Valuation Report for This Property
The Home Valuation Report is an in-depth analysis detailing your home's value as well as a comparison with similar homes in the area
Home Values in the Area
Average Home Value in this Area
Purchase History
| Date | Buyer | Sale Price | Title Company |
|---|---|---|---|
| Chau Jan | -- | None Available | |
| Chau Yan | -- | None Available | |
| He Hai Huan | -- | None Available | |
| Chau Yan Y | $61,057 | Attorney | |
| Hsbc Mortgage Services Inc | -- | None Available | |
| James David | -- | K E L Title Ins Agency Inc |
Source: Public Records
Mortgage History
| Date | Status | Borrower | Loan Amount |
|---|---|---|---|
| Previous Owner | James David | $111,000 |
Source: Public Records
Tax History Compared to Growth
Tax History
| Year | Tax Paid | Tax Assessment Tax Assessment Total Assessment is a certain percentage of the fair market value that is determined by local assessors to be the total taxable value of land and additions on the property. | Land | Improvement |
|---|---|---|---|---|
| 2024 | $4,943 | $299,913 | $59,846 | $240,067 |
| 2023 | $4,460 | $260,831 | $55,242 | $205,589 |
| 2022 | $4,115 | $250,927 | $46,035 | $204,892 |
| 2021 | $3,579 | $180,540 | $30,843 | $149,697 |
| 2020 | $3,371 | $183,116 | $30,843 | $152,273 |
| 2019 | $3,165 | $180,626 | $46,035 | $134,591 |
| 2018 | $2,833 | $150,461 | $0 | $0 |
| 2017 | $2,616 | $134,898 | $0 | $0 |
| 2016 | $2,304 | $104,550 | $0 | $0 |
| 2015 | $2,180 | $96,182 | $0 | $0 |
| 2014 | $1,159 | $84,988 | $0 | $0 |
| 2013 | -- | $92,559 | $0 | $0 |
Source: Public Records
Map
Nearby Homes
- 8053 Deerwood Cir
- 7819 E Elm St
- 6804 N 78th St
- 8209 Down Royal Rd
- 7818 Bally Money Rd
- 6213 Orient Rd
- 5505 Maple Ln
- 8202 Natchez St
- 8214 Riverboat Dr
- 7712 Deleuil Ave
- 7715 Deleuil Ave
- 8210 Clermont St
- 8315 Riverboat Dr
- 0 Harney Rd Unit MFRT3542590
- 7419 Savannah Ln
- 0 Us 301 Hwy N Unit 783121
- 7703 Robert e Lee Rd
- 5525 Wilkins Rd
- 7425 Terrace River Dr
- 7502 Gadsden Dr
- 8046 Fawnridge Cir
- 6709 Wood Branch Dr
- 8064 Deerwood Cir
- 8042 Fawnridge Cir
- 8043 Fawnridge Cir
- 8048 Fawnridge Cir
- 8045 Fawnridge Cir
- 8002 Deerwood Cir
- 0 Wood Branch Dr Unit 216010281
- 0 Wood Branch Dr Unit 216078453
- 8062 Deerwood Cir
- 8053 Fawnridge Cir
- 8041 Fawnridge Cir
- 8040 Fawnridge Cir
- 8050 Fawnridge Cir
- 8004 Deerwood Cir
- 8065 Deerwood Cir
- 8065 Fawnridge Cir
- 8063 Deerwood Cir
- 8063 Fawnridge Cir