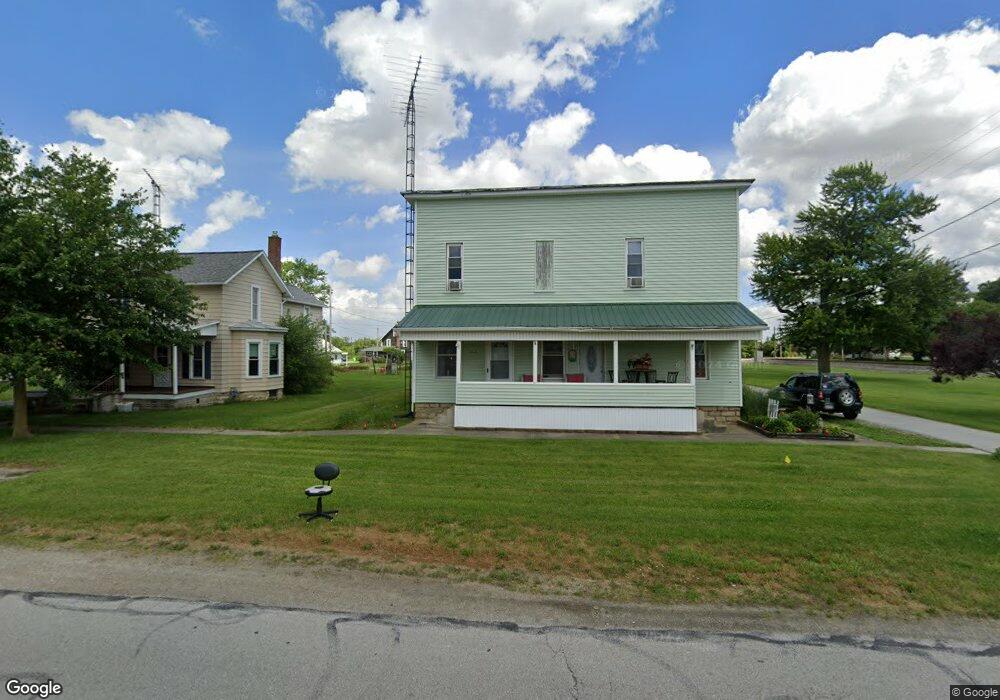
8045 Main St Old Fort, OH 44861
Estimated Value: $141,656 - $258,000
5
Beds
2
Baths
2,766
Sq Ft
$65/Sq Ft
Est. Value
About This Home
This home is located at 8045 Main St, Old Fort, OH 44861 and is currently estimated at $179,414, approximately $64 per square foot. 8045 Main St is a home located in Seneca County with nearby schools including Old Fort Elementary School Bettsville Campus and Old Fort High School.
Ownership History
Date
Name
Owned For
Owner Type
Purchase Details
Closed on
Aug 20, 2019
Sold by
Joseph Kevin J and Joseph Sheryl A
Bought by
Pauling Mark F
Current Estimated Value
Purchase Details
Closed on
Oct 24, 2013
Sold by
Myers Molly M and Myers Molly Mildred
Bought by
Joseph Kevin J and Joseph Sherly A
Home Financials for this Owner
Home Financials are based on the most recent Mortgage that was taken out on this home.
Original Mortgage
$25,500
Interest Rate
5.37%
Mortgage Type
Adjustable Rate Mortgage/ARM
Purchase Details
Closed on
Jan 25, 1996
Sold by
Myers Robert William
Bought by
Myers Molly Mildred
Create a Home Valuation Report for This Property
The Home Valuation Report is an in-depth analysis detailing your home's value as well as a comparison with similar homes in the area
Home Values in the Area
Average Home Value in this Area
Purchase History
| Date | Buyer | Sale Price | Title Company |
|---|---|---|---|
| Pauling Mark F | $41,000 | None Available | |
| Joseph Kevin J | $34,000 | Assured Title | |
| Myers Molly Mildred | -- | -- |
Source: Public Records
Mortgage History
| Date | Status | Borrower | Loan Amount |
|---|---|---|---|
| Previous Owner | Joseph Kevin J | $25,500 |
Source: Public Records
Tax History Compared to Growth
Tax History
| Year | Tax Paid | Tax Assessment Tax Assessment Total Assessment is a certain percentage of the fair market value that is determined by local assessors to be the total taxable value of land and additions on the property. | Land | Improvement |
|---|---|---|---|---|
| 2024 | $1,332 | $37,640 | $2,460 | $35,180 |
| 2023 | $1,313 | $37,640 | $2,460 | $35,180 |
| 2022 | $1,171 | $27,800 | $2,460 | $25,340 |
| 2021 | $1,159 | $27,800 | $2,460 | $25,340 |
| 2020 | $1,117 | $27,801 | $2,457 | $25,344 |
| 2019 | $1,046 | $27,027 | $2,457 | $24,570 |
| 2018 | $1,049 | $27,027 | $2,457 | $24,570 |
| 2017 | $958 | $27,027 | $2,457 | $24,570 |
| 2016 | $957 | $28,200 | $2,457 | $25,743 |
| 2015 | $950 | $28,200 | $2,457 | $25,743 |
| 2014 | $867 | $28,200 | $2,457 | $25,743 |
| 2013 | $672 | $28,200 | $2,457 | $25,743 |
Source: Public Records
Map
Nearby Homes
- 0 E Co Road 181
- 8399 N County Road 31
- 203 Washington St
- 230 State St
- 0 State Route 224 Unit 20240095
- 220 Maple Ln Unit 124
- 220 Maple Ln Unit Lot76
- 220 Maple Ln Unit 82
- 1813 Finley Dr
- 1722 Morrison Rd
- 10 Meadowbrook Dr
- 10 Meadowbrook Ln
- 64 River Run Dr Unit J
- 64 River Run Dr
- 3166 N County Road 11
- 4855 E County Road 38
- 1250 Morrison Rd
- 1719 Buckland Ave
- 915 Siler St
- 880 Cleveland Ave