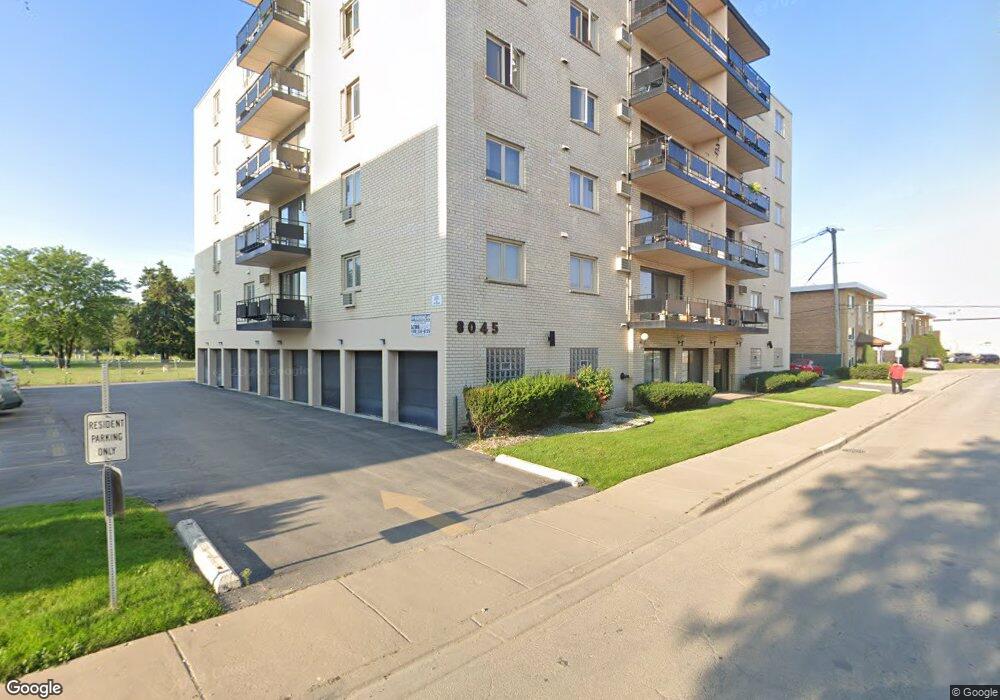
8045 Oconnor Dr Unit 4D River Grove, IL 60171
Estimated Value: $189,012 - $224,000
2
Beds
2
Baths
45,360
Sq Ft
$5/Sq Ft
Est. Value
About This Home
This home is located at 8045 Oconnor Dr Unit 4D, River Grove, IL 60171 and is currently estimated at $207,003, approximately $4 per square foot. 8045 Oconnor Dr Unit 4D is a home located in Cook County with nearby schools including River Grove School, St. Celestine School, and St. Francis Borgia School.
Ownership History
Date
Name
Owned For
Owner Type
Purchase Details
Closed on
Sep 14, 2018
Sold by
Broms Sharon J
Bought by
Vessini Donna
Current Estimated Value
Home Financials for this Owner
Home Financials are based on the most recent Mortgage that was taken out on this home.
Original Mortgage
$108,000
Outstanding Balance
$94,426
Interest Rate
5%
Mortgage Type
New Conventional
Estimated Equity
$112,577
Purchase Details
Closed on
Aug 23, 2006
Sold by
Paulas Phillip
Bought by
Broms Sharon J
Home Financials for this Owner
Home Financials are based on the most recent Mortgage that was taken out on this home.
Original Mortgage
$135,000
Interest Rate
6.7%
Mortgage Type
Unknown
Purchase Details
Closed on
May 1, 2003
Sold by
Thompson Richard Lloyd and Appleton Jean Mary
Bought by
Paulas Phillip
Home Financials for this Owner
Home Financials are based on the most recent Mortgage that was taken out on this home.
Original Mortgage
$145,000
Interest Rate
5.71%
Mortgage Type
Unknown
Create a Home Valuation Report for This Property
The Home Valuation Report is an in-depth analysis detailing your home's value as well as a comparison with similar homes in the area
Home Values in the Area
Average Home Value in this Area
Purchase History
| Date | Buyer | Sale Price | Title Company |
|---|---|---|---|
| Vessini Donna | $135,000 | Attorney | |
| Broms Sharon J | $230,000 | Prairie Title | |
| Paulas Phillip | $188,000 | Pntn | |
| Paulas Phillip | $188,000 | Pntn |
Source: Public Records
Mortgage History
| Date | Status | Borrower | Loan Amount |
|---|---|---|---|
| Open | Vessini Donna | $108,000 | |
| Previous Owner | Broms Sharon J | $135,000 | |
| Previous Owner | Paulas Phillip | $145,000 |
Source: Public Records
Tax History
| Year | Tax Paid | Tax Assessment Tax Assessment Total Assessment is a certain percentage of the fair market value that is determined by local assessors to be the total taxable value of land and additions on the property. | Land | Improvement |
|---|---|---|---|---|
| 2025 | $3,768 | $18,481 | $945 | $17,536 |
| 2024 | $3,768 | $14,968 | $793 | $14,175 |
| 2023 | $3,660 | $14,968 | $793 | $14,175 |
| 2022 | $3,660 | $14,968 | $793 | $14,175 |
| 2021 | $3,241 | $11,949 | $566 | $11,383 |
| 2020 | $3,160 | $11,949 | $566 | $11,383 |
| 2019 | $4,243 | $13,534 | $566 | $12,968 |
| 2018 | $2,406 | $10,373 | $491 | $9,882 |
| 2017 | $2,398 | $10,373 | $491 | $9,882 |
| 2016 | $2,487 | $10,691 | $491 | $10,200 |
| 2015 | $2,180 | $9,362 | $434 | $8,928 |
| 2014 | $2,177 | $9,362 | $434 | $8,928 |
| 2013 | $2,070 | $9,362 | $434 | $8,928 |
Source: Public Records
Map
Nearby Homes
- 8035 Oconnor Dr Unit 2E
- 3001 N Paris Ave Unit 207
- 3023 N Paris Ave Unit 108
- 3023 Paris Ave Unit 205
- 3045 N Paris Ave Unit 203
- 3101 Paris Ave Unit 307
- 3109 Paris Ave Unit 304
- 7925 W Cressett Dr
- 8245 W Belmont Ave Unit 4L
- 3207 N Pontiac Ave Unit 2S
- 2718 Budd St
- 8211 W Grand Ave
- 3322 N Pittsburgh Ave
- 3349 N Paris Ave
- 7807 W Cressett Dr
- 7934 W Grand Ave Unit 2W
- 8325 W Forest Preserve Ave
- 2547 Davisson St
- 2546 Webster St
- 7929 W Grand Ave Unit 101
- 8045 Oconnor Dr Unit 4C
- 8045 Oconnor Dr Unit 3B
- 8045 Oconnor Dr Unit 4B
- 8045 Oconnor Dr Unit 6F
- 8045 Oconnor Dr Unit 4F
- 8045 Oconnor Dr Unit 2E
- 8045 Oconnor Dr Unit 3D
- 8045 Oconnor Dr Unit 6E
- 8045 Oconnor Dr Unit 3C
- 8045 Oconnor Dr Unit 6C
- 8045 Oconnor Dr Unit 3A
- 8045 Oconnor Dr Unit 3F
- 8045 Oconnor Dr Unit 5D
- 8045 Oconnor Dr Unit 2D
- 8045 Oconnor Dr Unit 6B
- 8045 Oconnor Dr Unit 5A
- 8045 Oconnor Dr Unit 5E
- 8045 Oconnor Dr Unit 5F
- 8045 Oconnor Dr Unit 5C
- 8045 Oconnor Dr Unit 2C
Your Personal Tour Guide
Ask me questions while you tour the home.