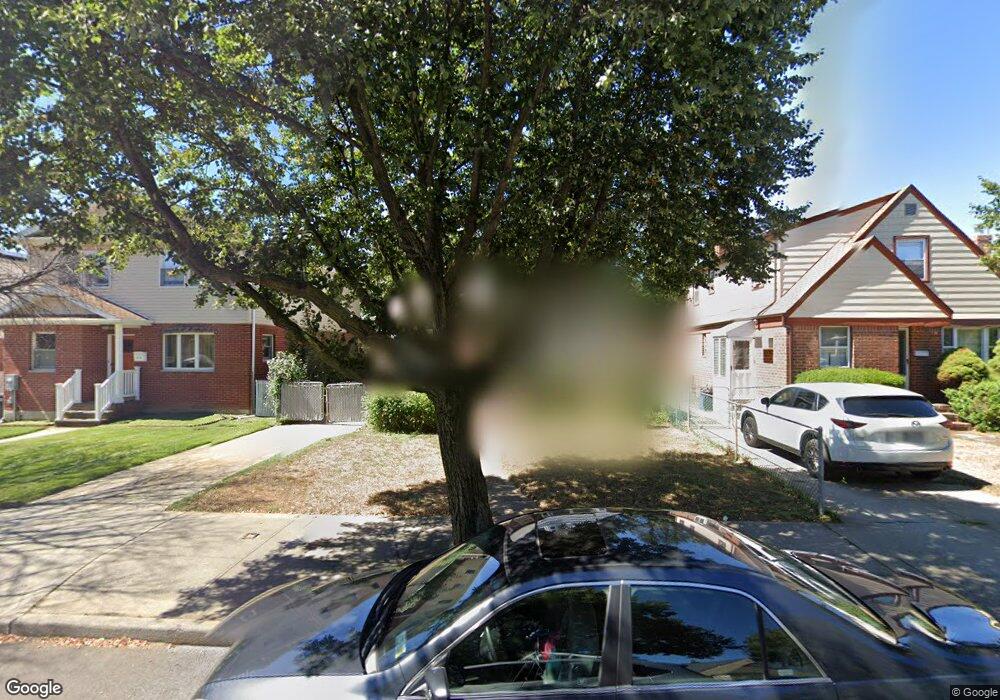
8046 256th St Glen Oaks, NY 11004
Estimated Value: $789,982 - $904,000
--
Bed
--
Bath
1,140
Sq Ft
$750/Sq Ft
Est. Value
About This Home
This home is located at 8046 256th St, Glen Oaks, NY 11004 and is currently estimated at $854,996, approximately $749 per square foot. 8046 256th St is a home located in Queens County with nearby schools including P.S.115Q James J Ambrose School, Fremont/Hay Elementary School, and Irwin Altman Middle School 172.
Ownership History
Date
Name
Owned For
Owner Type
Purchase Details
Closed on
Mar 18, 2021
Sold by
Thomas Leelamma and Thomas Tina
Bought by
Thomas Leelamma
Current Estimated Value
Purchase Details
Closed on
Mar 25, 2013
Sold by
Leelamma Thomas 2007 Revocable Trust and Leelamma Thomas Trustee
Bought by
Thomas Leelamma and Thomas Tina
Purchase Details
Closed on
Feb 27, 2007
Sold by
Thomas Leelamma
Bought by
Leelamma Thomas 2007 Revocable Living Tr and Thomas As Trustee Leelamma
Purchase Details
Closed on
Jul 25, 1997
Sold by
Kurian Thomas V and Thomas Leelamma V
Bought by
Thomas Leelamma
Purchase Details
Closed on
Jun 23, 1995
Sold by
Demner Dale
Bought by
Kurian Thomas and Thomas Leelamma
Home Financials for this Owner
Home Financials are based on the most recent Mortgage that was taken out on this home.
Original Mortgage
$159,500
Interest Rate
7.84%
Create a Home Valuation Report for This Property
The Home Valuation Report is an in-depth analysis detailing your home's value as well as a comparison with similar homes in the area
Home Values in the Area
Average Home Value in this Area
Purchase History
| Date | Buyer | Sale Price | Title Company |
|---|---|---|---|
| Thomas Leelamma | -- | -- | |
| Thomas Leelamma | -- | -- | |
| Thomas Leelamma | -- | -- | |
| Thomas Leelamma | -- | -- | |
| Thomas Leelamma | -- | -- | |
| Leelamma Thomas 2007 Revocable Living Tr | -- | -- | |
| Leelamma Thomas 2007 Revocable Living Tr | -- | -- | |
| Thomas Leelamma | -- | Titleserv | |
| Thomas Leelamma V | -- | Titleserv | |
| Kurian Thomas | $200,000 | Chicago Title Insurance Co | |
| Kurian Thomas V | $200,000 | Chicago Title Insurance Co |
Source: Public Records
Mortgage History
| Date | Status | Borrower | Loan Amount |
|---|---|---|---|
| Previous Owner | Kurian Thomas V | $159,500 |
Source: Public Records
Tax History Compared to Growth
Tax History
| Year | Tax Paid | Tax Assessment Tax Assessment Total Assessment is a certain percentage of the fair market value that is determined by local assessors to be the total taxable value of land and additions on the property. | Land | Improvement |
|---|---|---|---|---|
| 2025 | $8,613 | $45,395 | $14,324 | $31,071 |
| 2024 | $3,788 | $44,284 | $15,790 | $28,494 |
| 2023 | $8,181 | $42,134 | $14,708 | $27,426 |
| 2022 | $7,661 | $44,580 | $15,960 | $28,620 |
| 2021 | $7,667 | $41,700 | $15,960 | $25,740 |
| 2020 | $7,711 | $40,140 | $15,960 | $24,180 |
| 2019 | $7,427 | $40,560 | $15,960 | $24,600 |
| 2018 | $6,860 | $35,112 | $14,194 | $20,918 |
| 2017 | $6,463 | $33,177 | $15,483 | $17,694 |
| 2016 | $5,993 | $33,177 | $15,483 | $17,694 |
| 2015 | $1,668 | $31,524 | $16,966 | $14,558 |
| 2014 | $1,668 | $30,753 | $16,226 | $14,527 |
Source: Public Records
Map
Nearby Homes
- 80-27 257th St
- 8017 252nd St
- 80-37 259th St
- 8125 258th St
- 7734 Little Neck Pkwy
- 8127 252nd St
- 254-04 75th Ave Unit G-2
- 7719 252nd St
- 80-18 261st St
- 254-61 75th Ave Unit A11-1
- 8132 252nd St
- 8133 260th St
- 250-12 81st Ave
- 252-14 82nd Rd
- 80-01 249th St
- 8211 260th St
- 7636 250th St
- 81-42 250th St
- 254-07 74th Ave Unit GV64 B1-1
- 82-16 251st St