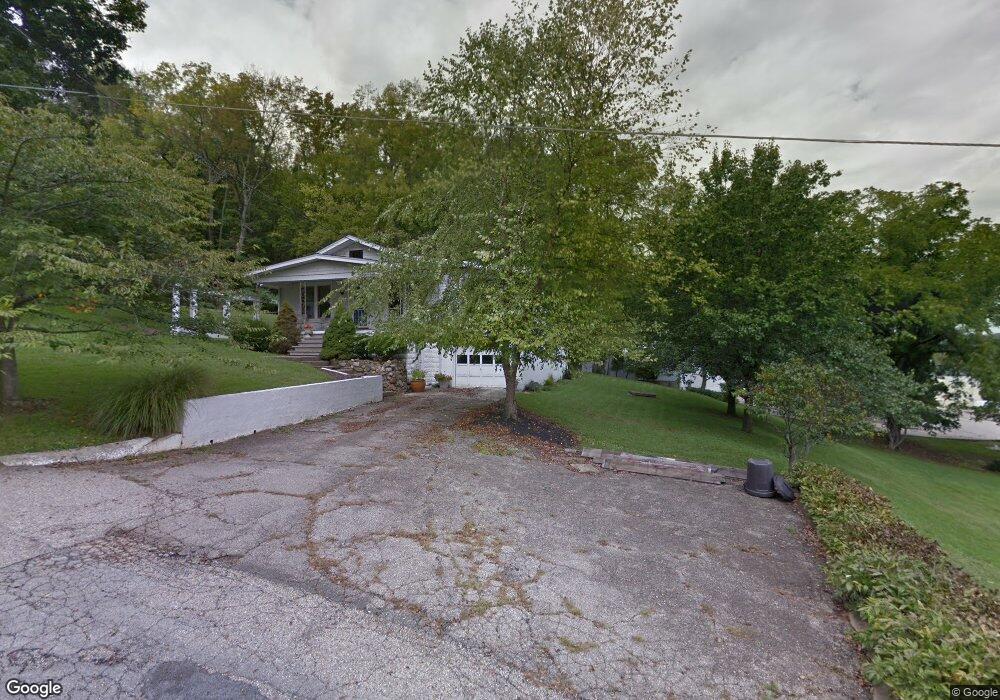
8046 Ferry St Miamitown, OH 45041
Estimated Value: $171,847 - $276,000
2
Beds
1
Bath
1,056
Sq Ft
$202/Sq Ft
Est. Value
About This Home
This home is located at 8046 Ferry St, Miamitown, OH 45041 and is currently estimated at $212,962, approximately $201 per square foot. 8046 Ferry St is a home with nearby schools including William Henry Harrison High School, Mt. Healthy Preparatory And Fitness Academy, and St. Bernard School.
Ownership History
Date
Name
Owned For
Owner Type
Purchase Details
Closed on
Mar 9, 2002
Sold by
Bachman Ruby and Bachman Jacob G
Bought by
Bachman Ruby and Bachman Diane M
Current Estimated Value
Create a Home Valuation Report for This Property
The Home Valuation Report is an in-depth analysis detailing your home's value as well as a comparison with similar homes in the area
Home Values in the Area
Average Home Value in this Area
Purchase History
| Date | Buyer | Sale Price | Title Company |
|---|---|---|---|
| Bachman Ruby | -- | -- |
Source: Public Records
Tax History Compared to Growth
Tax History
| Year | Tax Paid | Tax Assessment Tax Assessment Total Assessment is a certain percentage of the fair market value that is determined by local assessors to be the total taxable value of land and additions on the property. | Land | Improvement |
|---|---|---|---|---|
| 2024 | $2,448 | $37,814 | $9,450 | $28,364 |
| 2023 | $2,461 | $37,814 | $9,450 | $28,364 |
| 2022 | $2,394 | $31,161 | $8,183 | $22,978 |
| 2021 | $2,375 | $31,161 | $8,183 | $22,978 |
| 2020 | $2,392 | $31,161 | $8,183 | $22,978 |
| 2019 | $2,233 | $26,632 | $6,993 | $19,639 |
| 2018 | $2,243 | $26,632 | $6,993 | $19,639 |
| 2017 | $2,160 | $26,632 | $6,993 | $19,639 |
| 2016 | $1,956 | $24,942 | $6,654 | $18,288 |
| 2015 | $1,836 | $24,942 | $6,654 | $18,288 |
| 2014 | $1,840 | $24,942 | $6,654 | $18,288 |
| 2013 | $2,010 | $28,343 | $7,560 | $20,783 |
Source: Public Records
Map
Nearby Homes
- 6029 Ohio 128
- 5360 E Miami River Rd
- 7390 E Miami River Rd
- 8692 Harrison Ave
- 7780 E Miami River Rd
- 7238 Creekview Dr
- 7234 Creekview Dr
- 7226 Creekview Dr
- 5320 E Miami River Rd
- 8965 Bluejay View Dr
- 7298 Harrison Ave
- 7212 Creekview Dr
- 8828 Harrison Pike
- 7215 Creekview Dr
- 7970 Eagle Creek Rd
- 7146 Althaus Rd
- 7981 Oakbridge Way
- 8001 Oakbridge Way
- 5839 Konga Dr
- 7787 Skyview Cir
- 8050 Ferry St
- 6848 Hill St
- 6868 Hill St
- 8045 Ferry St
- 8028 Hill St
- 8040 Main St
- 8038 Main St
- 8015 Harrison Pike
- 8035 Harrison Ave
- 6578 State Route 128
- 6849 St Rt 128
- 6849 Ohio 128
- 8034 Main St
- 8028 Main St
- 8020 Harrison Ave
- 6785 St Rt 128
- 6745 Hamilton Cleves Rd
- 6769 St Rt 128
- 55-69 Ohio 128
- 6029 Ohio 128