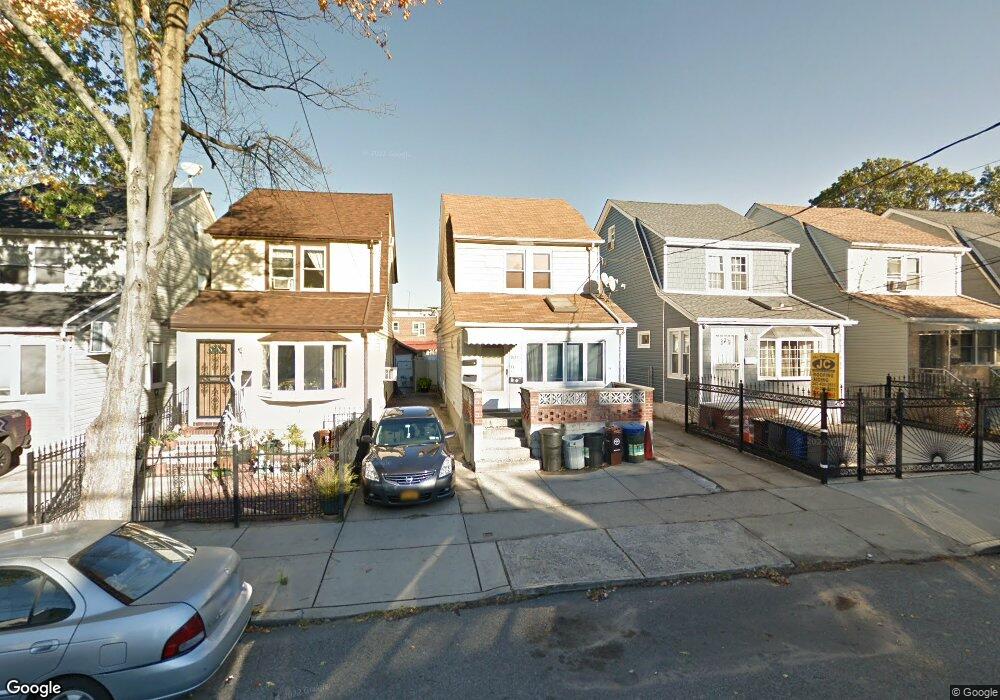
8047 162nd St Jamaica, NY 11432
Hillcrest NeighborhoodEstimated Value: $858,000 - $924,644
--
Bed
--
Bath
1,484
Sq Ft
$603/Sq Ft
Est. Value
About This Home
This home is located at 8047 162nd St, Jamaica, NY 11432 and is currently estimated at $894,161, approximately $602 per square foot. 8047 162nd St is a home located in Queens County with nearby schools including I.S. 250 - The Robert F. Kennedy Community Middle School, St. Nicholas of Tolentine Catholic Academy, and Al-Mamoor School.
Ownership History
Date
Name
Owned For
Owner Type
Purchase Details
Closed on
Jan 18, 2023
Sold by
Mantone James
Bought by
Legaspi Gerald John Baybay and Legaspi Marie Owynne
Current Estimated Value
Home Financials for this Owner
Home Financials are based on the most recent Mortgage that was taken out on this home.
Original Mortgage
$830,676
Outstanding Balance
$801,754
Interest Rate
6.31%
Mortgage Type
Purchase Money Mortgage
Estimated Equity
$92,407
Purchase Details
Closed on
Sep 28, 2012
Sold by
Mantone James and Sierra Mantone Olga
Bought by
Mantone James
Purchase Details
Closed on
May 27, 2003
Sold by
Rodriguez Alvaro and Rodriguez Marina
Bought by
Mantone James and Sierra Olga
Purchase Details
Closed on
Dec 21, 1995
Sold by
Rodriguez Jaime
Bought by
Rodriguez Jaime
Create a Home Valuation Report for This Property
The Home Valuation Report is an in-depth analysis detailing your home's value as well as a comparison with similar homes in the area
Home Values in the Area
Average Home Value in this Area
Purchase History
| Date | Buyer | Sale Price | Title Company |
|---|---|---|---|
| Legaspi Gerald John Baybay | $846,000 | -- | |
| Legaspi Gerald John Baybay | $846,000 | -- | |
| Legaspi Gerald John Baybay | $846,000 | -- | |
| Mantone James | -- | -- | |
| Mantone James | -- | -- | |
| Mantone James | $370,000 | -- | |
| Mantone James | $370,000 | -- | |
| Rodriguez Jaime | -- | -- | |
| Rodriguez Jaime | -- | -- |
Source: Public Records
Mortgage History
| Date | Status | Borrower | Loan Amount |
|---|---|---|---|
| Open | Legaspi Gerald John Baybay | $830,676 | |
| Closed | Legaspi Gerald John Baybay | $830,676 | |
| Closed | Mantone James | $0 |
Source: Public Records
Tax History Compared to Growth
Tax History
| Year | Tax Paid | Tax Assessment Tax Assessment Total Assessment is a certain percentage of the fair market value that is determined by local assessors to be the total taxable value of land and additions on the property. | Land | Improvement |
|---|---|---|---|---|
| 2025 | $6,992 | $36,827 | $9,383 | $27,444 |
| 2024 | $6,992 | $34,814 | $9,202 | $25,612 |
| 2023 | $6,597 | $32,844 | $9,601 | $23,243 |
| 2022 | $6,557 | $45,300 | $14,400 | $30,900 |
| 2021 | $6,846 | $45,060 | $14,400 | $30,660 |
| 2020 | $6,496 | $49,560 | $14,400 | $35,160 |
| 2019 | $6,069 | $42,960 | $14,400 | $28,560 |
| 2018 | $5,579 | $27,370 | $10,751 | $16,619 |
| 2017 | $5,579 | $27,370 | $11,965 | $15,405 |
| 2016 | $5,419 | $27,370 | $11,965 | $15,405 |
| 2015 | $3,114 | $25,574 | $14,050 | $11,524 |
| 2014 | $3,114 | $24,177 | $15,939 | $8,238 |
Source: Public Records
Map
Nearby Homes
- 8060 164th St
- 16414 81st Ave
- 8108 164th Place
- 8012 165th St
- 8010 165th St
- 8041 159th St
- 82-06 166th St
- 8135 166th St
- 166-21 Goethals Ave
- 15815 Union Turnpike Unit 2B
- 158-16 79th Ave Unit 411n
- 158-16 79th Ave Unit 204N
- 77-14 162nd St
- 8042 168th St
- 164-37 Grand Central Pkwy
- 158-36 77th Rd
- 164-34 77th Ave
- 164-38 77th Ave
- 162-15 77th Ave
- 80-15 168th St
- 8049 162nd St
- 8053 162nd St
- 8047 162nd St Unit 2
- 8053 162nd St
- 8047 162nd St
- 8055 162nd St
- 8043 162nd St
- 80-41 162nd St
- 8057 162nd St
- 8041 162nd St
- 8041 162nd St
- 8059 162nd St
- 8039 162nd St
- 8058 164th St
- 80-56 164th St Unit 1 fl
- 8056 164th St
- 8062 164th St
- 80-54-8164 164th St
- 8054 164th St
- 8064 164th St