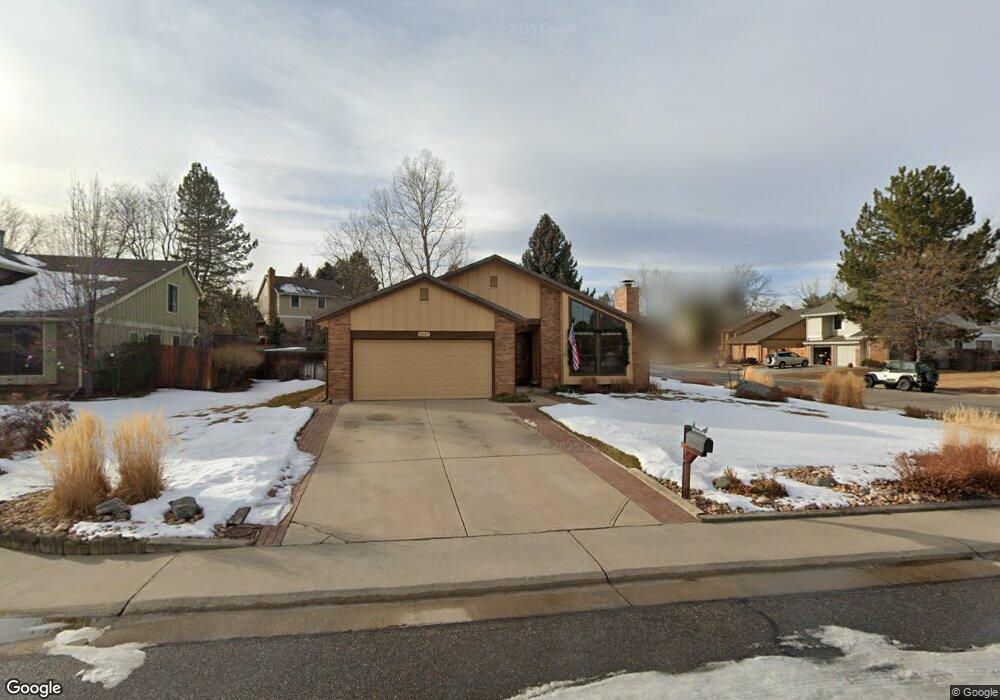
8047 Field Ct Arvada, CO 80005
Meadowglen NeighborhoodEstimated Value: $626,143 - $765,000
4
Beds
3
Baths
1,684
Sq Ft
$410/Sq Ft
Est. Value
About This Home
This home is located at 8047 Field Ct, Arvada, CO 80005 and is currently estimated at $691,036, approximately $410 per square foot. 8047 Field Ct is a home located in Jefferson County with nearby schools including Weber Elementary School, Pomona High School, and Doral Academy of Colorado.
Ownership History
Date
Name
Owned For
Owner Type
Purchase Details
Closed on
Oct 18, 2024
Sold by
Dan L Bradley And Susan J Bradley Trust and Bradley Dan L
Bought by
Bradley Susan J
Current Estimated Value
Purchase Details
Closed on
Aug 27, 2024
Sold by
Bradley Susan J
Bought by
Bradley Susan J and Dan L And Susan J Bradley Trust
Purchase Details
Closed on
Feb 17, 2011
Sold by
Bradley Dan L and Bradley Susan J
Bought by
Bradley Dan L and Bradley Susan J
Home Financials for this Owner
Home Financials are based on the most recent Mortgage that was taken out on this home.
Original Mortgage
$232,000
Interest Rate
4.15%
Mortgage Type
New Conventional
Purchase Details
Closed on
Mar 7, 2002
Sold by
Bradley Danny L and Bradley Susan J
Bought by
Bradley Dan L and Bradley Susan J
Create a Home Valuation Report for This Property
The Home Valuation Report is an in-depth analysis detailing your home's value as well as a comparison with similar homes in the area
Home Values in the Area
Average Home Value in this Area
Purchase History
| Date | Buyer | Sale Price | Title Company |
|---|---|---|---|
| Bradley Susan J | -- | None Listed On Document | |
| Bradley Susan J | -- | None Listed On Document | |
| Bradley Susan J | -- | None Listed On Document | |
| Bradley Dan L | -- | None Available | |
| Bradley Dan L | -- | -- |
Source: Public Records
Mortgage History
| Date | Status | Borrower | Loan Amount |
|---|---|---|---|
| Previous Owner | Bradley Dan L | $232,000 |
Source: Public Records
Tax History
| Year | Tax Paid | Tax Assessment Tax Assessment Total Assessment is a certain percentage of the fair market value that is determined by local assessors to be the total taxable value of land and additions on the property. | Land | Improvement |
|---|---|---|---|---|
| 2024 | $3,231 | $40,014 | $16,004 | $24,010 |
| 2023 | $3,231 | $40,014 | $16,004 | $24,010 |
| 2022 | $2,433 | $31,796 | $10,370 | $21,426 |
| 2021 | $2,473 | $32,711 | $10,668 | $22,043 |
| 2020 | $2,212 | $30,071 | $10,709 | $19,362 |
| 2019 | $2,182 | $30,071 | $10,709 | $19,362 |
| 2018 | $1,801 | $25,596 | $7,767 | $17,829 |
| 2017 | $1,649 | $25,596 | $7,767 | $17,829 |
| 2016 | $1,558 | $24,338 | $6,794 | $17,544 |
| 2015 | $1,216 | $24,338 | $6,794 | $17,544 |
| 2014 | $1,216 | $19,972 | $6,408 | $13,564 |
Source: Public Records
Map
Nearby Homes
- 8010 Garrison Ct Unit C
- 8191 Everett Way
- 8324 Everett Way
- 8037 Iris Ct
- 8156 Carr Cir
- 8049 Jellison St
- 9760 W 82nd Place
- 8209 Balsam Way
- 8427 Everett Way Unit D
- 8442 Everett Way Unit D
- 8430 Everett Way Unit E
- 8465 Dover Way
- 8438 Everett Way Unit B
- 0 80th Ave
- 9738 Sierra Dr
- 8462 Everett Way Unit C
- 8039 Lee Dr Unit 102
- 8419 W 75th Way
- 8096 Lee Ct
- 10213 W 80th Dr Unit B
Your Personal Tour Guide
Ask me questions while you tour the home.