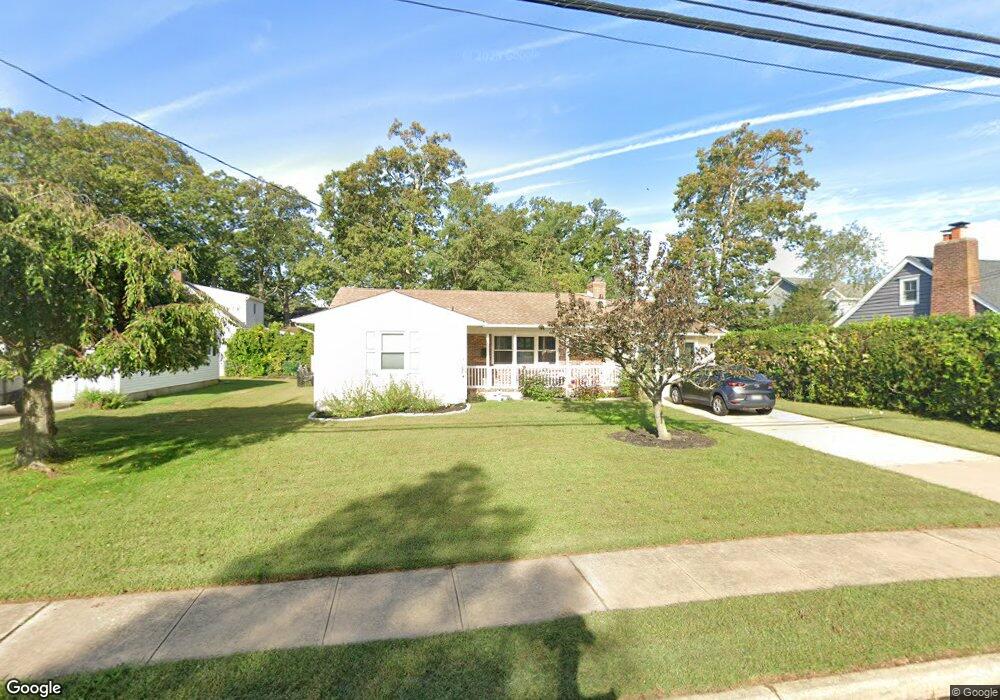
805 6th Ave Spring Lake, NJ 07762
Estimated Value: $811,000 - $1,126,000
3
Beds
2
Baths
1,237
Sq Ft
$795/Sq Ft
Est. Value
About This Home
This home is located at 805 6th Ave, Spring Lake, NJ 07762 and is currently estimated at $983,998, approximately $795 per square foot. 805 6th Ave is a home located in Monmouth County with nearby schools including Spring Lake Heights Elementary School and St. Catharine School.
Ownership History
Date
Name
Owned For
Owner Type
Purchase Details
Closed on
May 25, 2023
Sold by
Brodsky Barry and Brodsky Patricia M
Bought by
Brodsky Barry M and Brodsky Patricia M
Current Estimated Value
Purchase Details
Closed on
Nov 12, 2021
Sold by
Kuzianik David G and Brodsky Patricia
Bought by
Brodsky Barry and Brodsky Patricia M
Purchase Details
Closed on
Apr 7, 2016
Sold by
Brodsky Patricia M and Kuzianik David G
Bought by
Kuzianik David G and Brodsky Patricia M
Purchase Details
Closed on
Mar 8, 2011
Sold by
Kuzianik Gertrude
Bought by
Kuzianik Gertrude I and Brodsky Patricia M
Purchase Details
Closed on
Dec 19, 2002
Sold by
Lizoamol Eddie
Bought by
Kuzianik Eddie and Kuzianik Gertrude
Create a Home Valuation Report for This Property
The Home Valuation Report is an in-depth analysis detailing your home's value as well as a comparison with similar homes in the area
Home Values in the Area
Average Home Value in this Area
Purchase History
| Date | Buyer | Sale Price | Title Company |
|---|---|---|---|
| Brodsky Barry M | -- | None Listed On Document | |
| Brodsky Barry | $552,000 | Trident Abstract Ttl Agcy Ll | |
| Kuzianik David G | -- | None Available | |
| Kuzianik Gertrude I | -- | None Available | |
| Kuzianik Eddie | -- | -- |
Source: Public Records
Tax History
| Year | Tax Paid | Tax Assessment Tax Assessment Total Assessment is a certain percentage of the fair market value that is determined by local assessors to be the total taxable value of land and additions on the property. | Land | Improvement |
|---|---|---|---|---|
| 2025 | $8,249 | $839,100 | $661,500 | $177,600 |
| 2024 | $7,435 | $783,400 | $609,000 | $174,400 |
Source: Public Records
Map
Nearby Homes
- 513 Mercer Ave
- 604 Monmouth Ave
- 530 Highway 71 Unit 4
- 53 Dogwood Dr
- 23 Locust Way
- 305 4th Ave
- 570 Central Ave
- 200 Monmouth Ave Unit 19
- 200 Monmouth Ave Unit 27
- 200 Monmouth Ave Unit 21
- 200 Monmouth Ave Unit 5
- 574 Central Ave
- 208 Salem Ave
- 16 Sussex Ave
- 117 Madison Ave
- 909 Jersey Ave
- 809 Wall Rd
- 510 Beacon Blvd
- 2419 Kipling Ave
- 2005 Nassau Dr
Your Personal Tour Guide
Ask me questions while you tour the home.