Estimated Value: $384,698 - $469,000
4
Beds
3
Baths
2,453
Sq Ft
$179/Sq Ft
Est. Value
About This Home
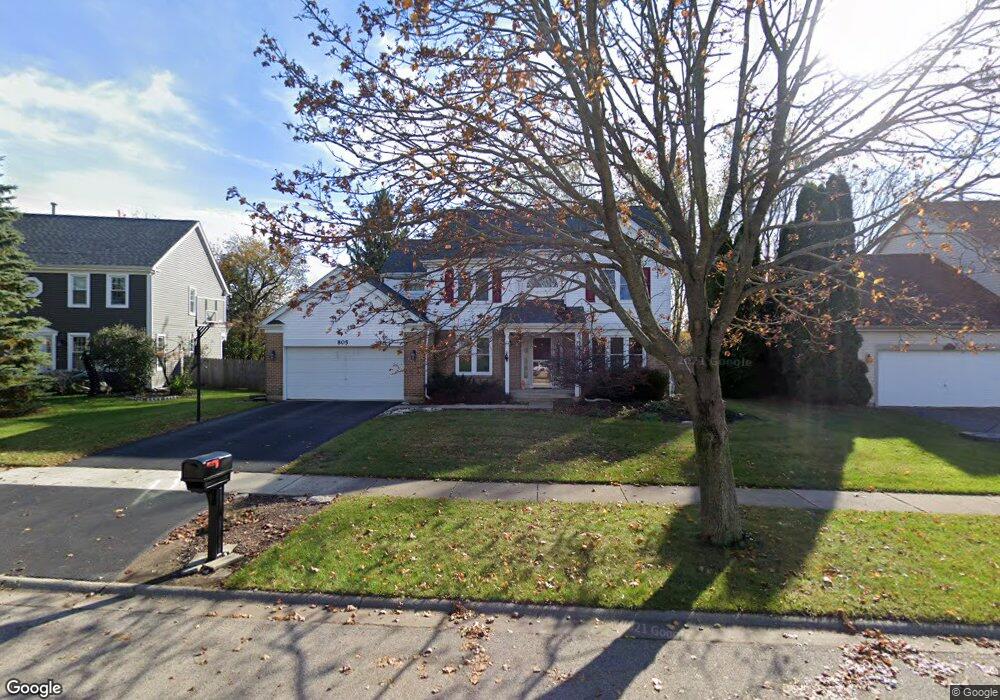
This home is located at 805 Blue Mesa Trail, Cary, IL 60013 and is currently estimated at $437,925, approximately $178 per square foot. 805 Blue Mesa Trail is a home located in McHenry County with nearby schools including Briargate Elementary School, Cary Jr High School, and Cary-Grove High School.
Ownership History
Date
Name
Owned For
Owner Type
Purchase Details
Closed on
Sep 8, 2025
Sold by
Kedzior Walter and Kedzior Susan
Bought by
Walter Kedzior And Susan Kedzior Joint Declar and Kedzior
Current Estimated Value
Purchase Details
Closed on
May 25, 2005
Sold by
Galasso Craig S and Galasso Patricia A
Bought by
Kedzior Walter and Kedzior Susan
Home Financials for this Owner
Home Financials are based on the most recent Mortgage that was taken out on this home.
Original Mortgage
$272,000
Interest Rate
6.07%
Mortgage Type
Fannie Mae Freddie Mac
Purchase Details
Closed on
Dec 18, 1998
Sold by
Galasso Craig S and Galasso Patricia
Bought by
Galasso Craig S and Galasso Patricia
Home Financials for this Owner
Home Financials are based on the most recent Mortgage that was taken out on this home.
Original Mortgage
$172,500
Interest Rate
6.75%
Purchase Details
Closed on
Feb 10, 1994
Sold by
Mercer Kenneth H and Mercer Julie A
Bought by
Galasso Craig S and Galasso Patricia
Home Financials for this Owner
Home Financials are based on the most recent Mortgage that was taken out on this home.
Original Mortgage
$163,800
Interest Rate
7.84%
Create a Home Valuation Report for This Property
The Home Valuation Report is an in-depth analysis detailing your home's value as well as a comparison with similar homes in the area
Home Values in the Area
Average Home Value in this Area
Purchase History
| Date | Buyer | Sale Price | Title Company |
|---|---|---|---|
| Walter Kedzior And Susan Kedzior Joint Declar | -- | None Listed On Document | |
| Kedzior Walter | $340,000 | Multiple | |
| Galasso Craig S | -- | Intercounty Title | |
| Galasso Craig S | $307,500 | -- |
Source: Public Records
Mortgage History
| Date | Status | Borrower | Loan Amount |
|---|---|---|---|
| Previous Owner | Kedzior Walter | $272,000 | |
| Previous Owner | Galasso Craig S | $172,500 | |
| Previous Owner | Galasso Craig S | $163,800 |
Source: Public Records
Tax History
| Year | Tax Paid | Tax Assessment Tax Assessment Total Assessment is a certain percentage of the fair market value that is determined by local assessors to be the total taxable value of land and additions on the property. | Land | Improvement |
|---|---|---|---|---|
| 2024 | $9,728 | $123,521 | $21,030 | $102,491 |
| 2023 | $9,486 | $110,474 | $18,809 | $91,665 |
| 2022 | $9,701 | $109,600 | $22,610 | $86,990 |
| 2021 | $9,247 | $102,106 | $21,064 | $81,042 |
| 2020 | $8,974 | $98,491 | $20,318 | $78,173 |
| 2019 | $8,798 | $94,268 | $19,447 | $74,821 |
| 2018 | $8,296 | $87,084 | $17,965 | $69,119 |
| 2017 | $8,138 | $82,038 | $16,924 | $65,114 |
| 2016 | $8,077 | $76,944 | $15,873 | $61,071 |
| 2013 | -- | $80,796 | $14,807 | $65,989 |
Source: Public Records
Map
Nearby Homes
- 386 Copper Canyon Trail
- 0 Kaper Dr
- 413 Haber Rd Unit 5
- 417 Haber Rd Unit 6
- 421 Haber Rd Unit 7
- 425 Haber Rd Unit 6
- 377 Geneva Ln Unit 1
- 256 Haber Ct
- 550 Norman Dr
- 1145 Amber Dr
- 3712 3 Oaks Rd
- 204 Country Commons Rd
- 1387 New Haven Dr
- 461 W Oriole Trail
- 16 Forest Ln
- 548 New Haven Dr
- 418 Glen Garry Rd
- Lots 2,3,4 Northwest Hwy
- 330 Park Ave
- 1100 Oak Valley Dr
- 813 Blue Mesa Trail
- 801 Blue Mesa Trail
- 806 Merrimac St
- 800 Merrimac St
- 814 Merrimac St
- 825 Blue Mesa Trail
- 210 Conestoga Trail
- 201 Conestoga Trail
- 820 Merrimac St
- 12 Rodeo Cir
- 837 Blue Mesa Trail
- 207 Conestoga Trail
- 774 Merrimac St
- 826 Merrimac St
- 222 Conestoga Trail
- 215 Conestoga Trail
- 10 Rodeo Cir
- 768 Merrimac St
- 849 Blue Mesa Trail
- 76 Chelsea Ln