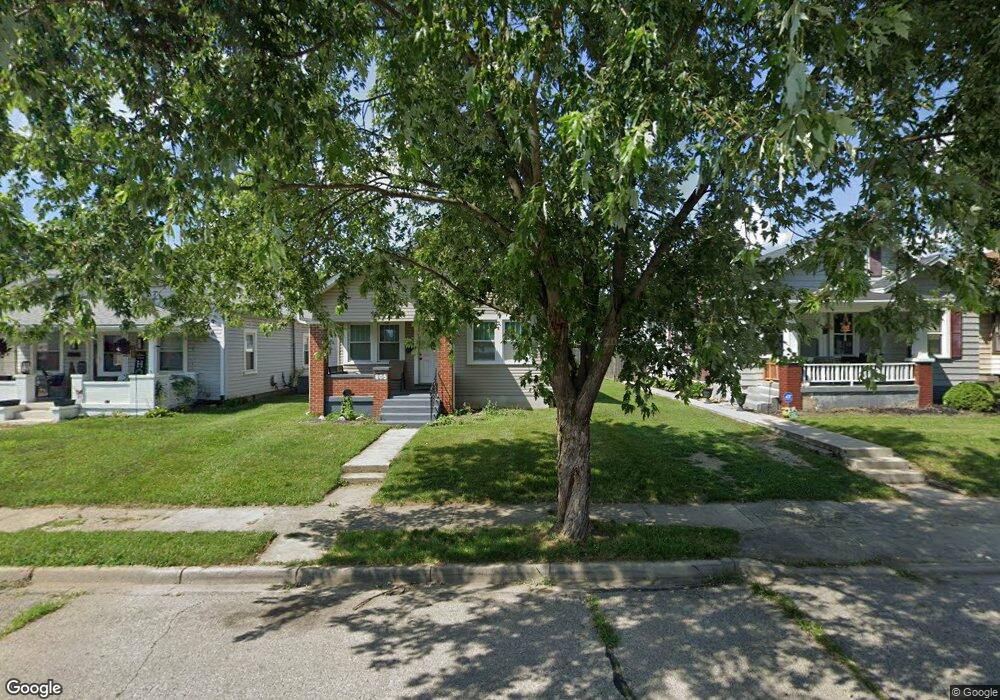
805 Cottage Ave Miamisburg, OH 45342
Downtown Miamisburg NeighborhoodEstimated Value: $153,000 - $173,000
3
Beds
1
Bath
960
Sq Ft
$170/Sq Ft
Est. Value
About This Home
This home is located at 805 Cottage Ave, Miamisburg, OH 45342 and is currently estimated at $162,749, approximately $169 per square foot. 805 Cottage Ave is a home located in Montgomery County with nearby schools including Miamisburg High School and Bethel Baptist School.
Ownership History
Date
Name
Owned For
Owner Type
Purchase Details
Closed on
Apr 29, 2022
Sold by
Richard Sensabaugh
Bought by
Clark Randall B
Current Estimated Value
Home Financials for this Owner
Home Financials are based on the most recent Mortgage that was taken out on this home.
Original Mortgage
$134,500
Outstanding Balance
$127,599
Interest Rate
5.1%
Mortgage Type
VA
Estimated Equity
$35,150
Purchase Details
Closed on
Jul 16, 2010
Sold by
Secretary Of Housing & Urban Development
Bought by
Sensabaugh Richard
Purchase Details
Closed on
Oct 29, 2009
Sold by
Hensley Laurie A and Hensley Rickey
Bought by
Colonial Savings Fa
Purchase Details
Closed on
Oct 21, 2009
Sold by
Colonial Savings Fa
Bought by
The Secretary Of Housing & Urban Develop
Purchase Details
Closed on
Feb 3, 1998
Sold by
Cooley Ada W
Bought by
Wright Laurie A and Hensley Laurie A
Create a Home Valuation Report for This Property
The Home Valuation Report is an in-depth analysis detailing your home's value as well as a comparison with similar homes in the area
Home Values in the Area
Average Home Value in this Area
Purchase History
| Date | Buyer | Sale Price | Title Company |
|---|---|---|---|
| Clark Randall B | -- | Vantage Land Title | |
| Sensabaugh Richard | $21,500 | Attorney | |
| Colonial Savings Fa | $25,000 | None Available | |
| The Secretary Of Housing & Urban Develop | -- | Attorney | |
| Wright Laurie A | -- | -- | |
| Hensley Laurie | -- | -- |
Source: Public Records
Mortgage History
| Date | Status | Borrower | Loan Amount |
|---|---|---|---|
| Open | Clark Randall B | $134,500 |
Source: Public Records
Tax History Compared to Growth
Tax History
| Year | Tax Paid | Tax Assessment Tax Assessment Total Assessment is a certain percentage of the fair market value that is determined by local assessors to be the total taxable value of land and additions on the property. | Land | Improvement |
|---|---|---|---|---|
| 2024 | $2,830 | $43,450 | $5,410 | $38,040 |
| 2023 | $2,830 | $43,450 | $5,410 | $38,040 |
| 2022 | $2,334 | $30,170 | $3,760 | $26,410 |
| 2021 | $2,073 | $30,170 | $3,760 | $26,410 |
| 2020 | $2,059 | $30,030 | $3,760 | $26,270 |
| 2019 | $1,845 | $24,670 | $3,760 | $20,910 |
| 2018 | $1,587 | $21,100 | $3,760 | $17,340 |
| 2017 | $1,577 | $21,100 | $3,760 | $17,340 |
| 2016 | $1,605 | $20,690 | $3,760 | $16,930 |
| 2015 | $1,574 | $20,690 | $3,760 | $16,930 |
| 2014 | $1,574 | $20,690 | $3,760 | $16,930 |
| 2012 | -- | $20,950 | $5,570 | $15,380 |
Source: Public Records
Map
Nearby Homes
- 948 Kercher St
- 555 E Sycamore St
- 816 E Pearl St
- 1121 Dayket Cir
- 832 E Maple Ave
- 319 N 1st St
- 607 E Central Ave
- 740 E Central Ave
- 1232 Hollyhill Dr
- 24 S 8th St
- 1123 E Maple Ave Unit 1121
- 1137 E Pearl St
- 736 Park Ave
- 1131 E Central Ave
- 805 E Linden Ave
- 1109 Sundance Dr
- 42 S Main St
- 235 S 7th St
- 619 Jefferson St
- 111 S Main St
- 801 Cottage Ave
- 809 Cottage Ave
- 815 Cottage Ave
- 824 N 8th St
- 819 Cottage Ave
- 731 Cottage Ave
- 826 N 8th St
- 821 Cottage Ave
- 725 Cottage Ave
- 804 Cottage Ave
- 810 Cottage Ave
- 814 Cottage Ave
- 825 Cottage Ave
- 721 Cottage Ave
- 818 Cottage Ave
- 732 Cottage Ave
- 829 Cottage Ave
- 822 Cottage Ave
- 726 Cottage Ave
- 719 Cottage Ave