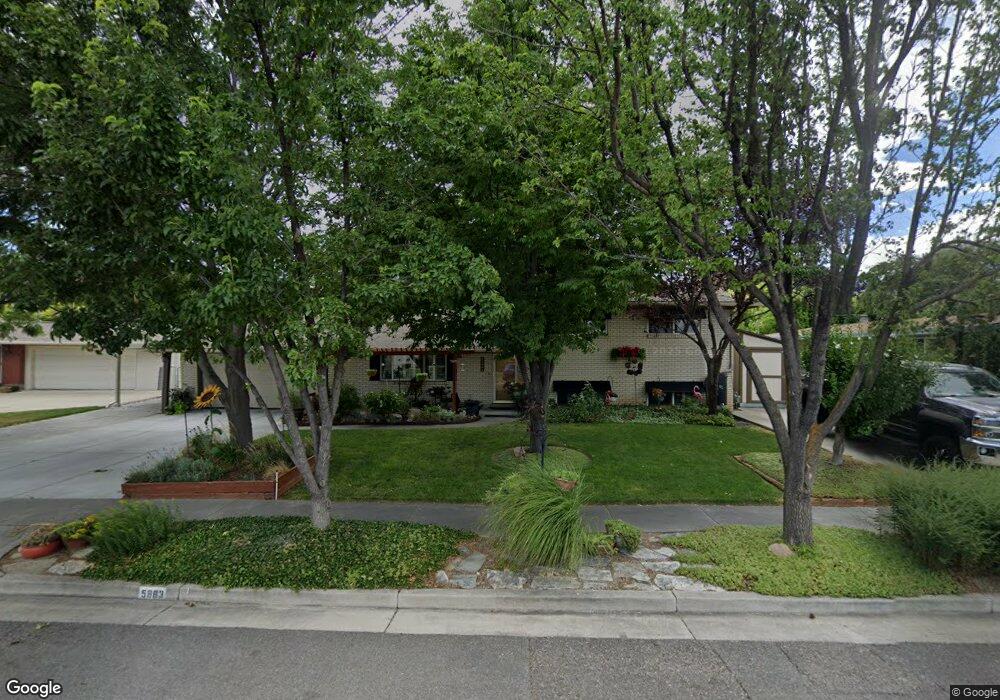
805 E 5900 S Salt Lake City, UT 84107
Estimated Value: $901,000 - $1,079,000
4
Beds
5
Baths
3,477
Sq Ft
$288/Sq Ft
Est. Value
About This Home
This home is located at 805 E 5900 S, Salt Lake City, UT 84107 and is currently estimated at $999,969, approximately $287 per square foot. 805 E 5900 S is a home located in Salt Lake County with nearby schools including McMillan Elementary School, Hillcrest Junior High School, and Murray High School.
Ownership History
Date
Name
Owned For
Owner Type
Purchase Details
Closed on
Jan 31, 2006
Sold by
Bordiga Michael J and Cummins Ann
Bought by
Bordiga Michael J and Cummins Ann P
Current Estimated Value
Home Financials for this Owner
Home Financials are based on the most recent Mortgage that was taken out on this home.
Original Mortgage
$122,778
Outstanding Balance
$4,404
Interest Rate
6.21%
Mortgage Type
Unknown
Estimated Equity
$995,565
Purchase Details
Closed on
Jan 4, 2000
Sold by
Bordiga Michael J
Bought by
Bordiga Michael J and Cummings Ann
Home Financials for this Owner
Home Financials are based on the most recent Mortgage that was taken out on this home.
Original Mortgage
$227,000
Outstanding Balance
$71,473
Interest Rate
7.72%
Estimated Equity
$928,496
Purchase Details
Closed on
Aug 14, 1996
Sold by
Berry Kenneth J and Berry Samraing
Bought by
Bordiga Michael J
Purchase Details
Closed on
Dec 5, 1994
Sold by
Afridi Abdule R and Afridi Fatima B
Bought by
Berry Kenneth J and Berry Samraing
Create a Home Valuation Report for This Property
The Home Valuation Report is an in-depth analysis detailing your home's value as well as a comparison with similar homes in the area
Home Values in the Area
Average Home Value in this Area
Purchase History
| Date | Buyer | Sale Price | Title Company |
|---|---|---|---|
| Bordiga Michael J | -- | Metro National Title | |
| Bordiga Michael J | -- | Bonneville Title Company | |
| Bordiga Michael J | -- | -- | |
| Berry Kenneth J | -- | -- |
Source: Public Records
Mortgage History
| Date | Status | Borrower | Loan Amount |
|---|---|---|---|
| Open | Bordiga Michael J | $122,778 | |
| Open | Bordiga Michael J | $227,000 |
Source: Public Records
Tax History Compared to Growth
Tax History
| Year | Tax Paid | Tax Assessment Tax Assessment Total Assessment is a certain percentage of the fair market value that is determined by local assessors to be the total taxable value of land and additions on the property. | Land | Improvement |
|---|---|---|---|---|
| 2025 | $4,018 | $940,500 | $318,400 | $622,100 |
| 2024 | $4,018 | $891,200 | $307,900 | $583,300 |
| 2023 | $3,148 | $668,800 | $276,900 | $391,900 |
| 2022 | $3,195 | $645,300 | $271,500 | $373,800 |
| 2021 | $3,444 | $613,400 | $300,500 | $312,900 |
| 2020 | $3,453 | $582,000 | $300,500 | $281,500 |
| 2019 | $3,615 | $588,600 | $290,900 | $297,700 |
| 2018 | $3,750 | $623,200 | $306,200 | $317,000 |
| 2017 | $3,700 | $619,900 | $227,500 | $392,400 |
| 2016 | $3,717 | $601,200 | $227,500 | $373,700 |
| 2015 | $3,234 | $475,100 | $225,500 | $249,600 |
| 2014 | -- | $449,500 | $221,000 | $228,500 |
Source: Public Records
Map
Nearby Homes
- 832 E Deerfield Rd
- 869 E Vine St
- 5809 Holstein Way
- 6114 S Corbin Creek Cove
- 537 E Edindrew Dr
- 664 E 5720 S
- 834 E Southwood Dr
- 496 E 5980 S
- 1085 E 6165 S Unit 33
- 418 E Bridlewalk Ln
- 602 E 5600 S
- 1179 E 6200 S
- 5882 Meadowcrest Dr
- 5536 Springtree Ln Unit A
- 341 E Wilford Ave
- 5560 S Willow Ln Unit D
- 5561 S Willow Ln Unit F
- 5775 S Fashion Blvd
- 5555 S Willow Ln Unit E
- 5572 S Avalon Dr
- 803 E 5900 S
- 5878 Eastwood Cir
- 5876 S Eastwood Cir
- 5875 Homestead Ct
- 807 E 5900 S
- 5883 Homestead Ct
- 5870 S Eastwood Cir
- 5870 Eastwood Cir
- 5867 S Homestead Ct
- 5867 Homestead Ct
- 5892 S Eastwood Cir
- 815 E 5900 S
- 5891 Homestead Ct
- 5889 S Eastwood Cir E
- 5864 Homestead Ct
- 5880 Homestead Ct
- 5889 Eastwood Cir
- 5889 S Eastwood Cir
- 779 E 5900 S
- 5866 Homestead Ct