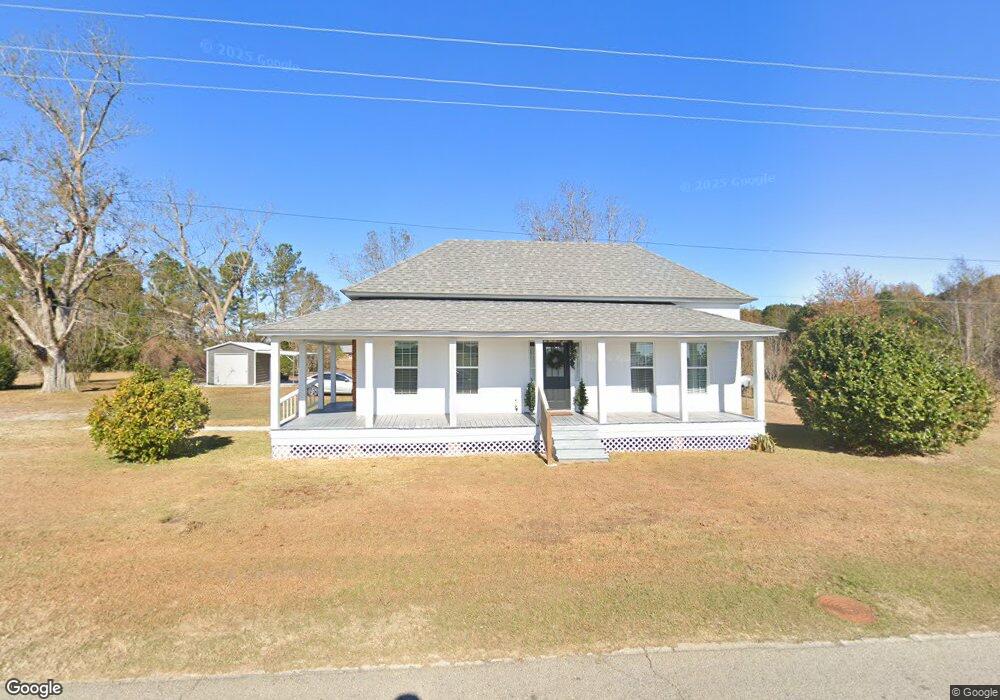
805 E Ogeechee St Sylvania, GA 30467
Estimated Value: $198,000 - $408,000
3
Beds
2
Baths
1,544
Sq Ft
$198/Sq Ft
Est. Value
About This Home
This home is located at 805 E Ogeechee St, Sylvania, GA 30467 and is currently estimated at $305,509, approximately $197 per square foot. 805 E Ogeechee St is a home located in Screven County with nearby schools including Screven County Elementary School, Screven County Middle School, and Screven County High School.
Ownership History
Date
Name
Owned For
Owner Type
Purchase Details
Closed on
Oct 13, 2023
Sold by
Martin Cameron Robert
Bought by
Deal Brian A and Deal Crystal H
Current Estimated Value
Home Financials for this Owner
Home Financials are based on the most recent Mortgage that was taken out on this home.
Original Mortgage
$275,000
Outstanding Balance
$269,153
Interest Rate
7.18%
Mortgage Type
New Conventional
Estimated Equity
$36,356
Purchase Details
Closed on
Aug 30, 2022
Sold by
Owens Timmy Joe
Bought by
Martin Cameron Robert and Potter Darrell Brooks
Home Financials for this Owner
Home Financials are based on the most recent Mortgage that was taken out on this home.
Original Mortgage
$150,000
Interest Rate
4.99%
Mortgage Type
New Conventional
Purchase Details
Closed on
Nov 14, 2017
Sold by
Owens Tillman
Bought by
Owens Mary
Purchase Details
Closed on
Jun 25, 1998
Sold by
Flythe W F
Bought by
Owens Tillman
Create a Home Valuation Report for This Property
The Home Valuation Report is an in-depth analysis detailing your home's value as well as a comparison with similar homes in the area
Home Values in the Area
Average Home Value in this Area
Purchase History
| Date | Buyer | Sale Price | Title Company |
|---|---|---|---|
| Deal Brian A | $300,000 | -- | |
| Martin Cameron Robert | $70,000 | -- | |
| Owens Mary | -- | -- | |
| Owens Timmy Joe | -- | -- | |
| Owens Tillman | $8,000 | -- |
Source: Public Records
Mortgage History
| Date | Status | Borrower | Loan Amount |
|---|---|---|---|
| Open | Deal Brian A | $275,000 | |
| Previous Owner | Martin Cameron Robert | $150,000 |
Source: Public Records
Tax History
| Year | Tax Paid | Tax Assessment Tax Assessment Total Assessment is a certain percentage of the fair market value that is determined by local assessors to be the total taxable value of land and additions on the property. | Land | Improvement |
|---|---|---|---|---|
| 2025 | $2,035 | $71,268 | $6,080 | $65,188 |
| 2024 | $2,648 | $81,588 | $3,680 | $77,908 |
| 2023 | $805 | $23,480 | $3,680 | $19,800 |
| 2022 | $765 | $22,320 | $3,680 | $18,640 |
| 2021 | $731 | $20,200 | $3,320 | $16,880 |
| 2020 | $722 | $19,280 | $3,320 | $15,960 |
| 2019 | $734 | $19,640 | $3,320 | $16,320 |
| 2018 | $670 | $19,080 | $3,320 | $15,760 |
| 2017 | $670 | $19,080 | $3,320 | $15,760 |
| 2016 | $733 | $19,080 | $3,320 | $15,760 |
| 2015 | -- | $18,840 | $3,320 | $15,520 |
| 2014 | -- | $18,720 | $3,320 | $15,400 |
| 2013 | -- | $19,240 | $3,840 | $15,400 |
Source: Public Records
Map
Nearby Homes
- 0 Poor Robin Unit 329695
- 416 Abram St
- 0 Runs Branch Rd Unit 10617232
- 502 S Hull St
- 302 Randall St
- 406 N Main St
- 123 Hiers Ave
- 221 N Main Streets
- 107 Dixie Ave
- 501 N Main St
- 1148 Savannah Hwy
- 1161 Savannah Hwy
- 222 Bridgeton Dr
- 315 Cork Pond Rd
- 223 N Lake Dr
- 205 Dogwood Dr
- 0 Halcyondale Rd Unit 10536056
- 0 Halcyondale Rd Unit SA331612
- 0 Burtons Ferry Hwy Unit 10475688
- 104 Wildwood St
- 721 E Ogeechee St
- 719 E Ogeechee St
- 719 E Ogeechee St
- 707 E Ogeechee St
- 703 E Ogeechee St
- 0 Friendship Road Lot 1 Rd Unit 20136829
- E E Ogeechee St
- 618 E Ogeechee St
- 615 E Ogeechee St
- 609 E Ogeechee St
- 153 Friendship Rd
- 842 Brannens Bridge Rd
- 523 E Ogeechee St
- 103 Lovett St
- 836 Brannens Bridge Rd
- 208 Lovett St
- 519 E Ogeechee St
- 515 E Ogeechee St
- 317 Jule St
- 315 Jule St