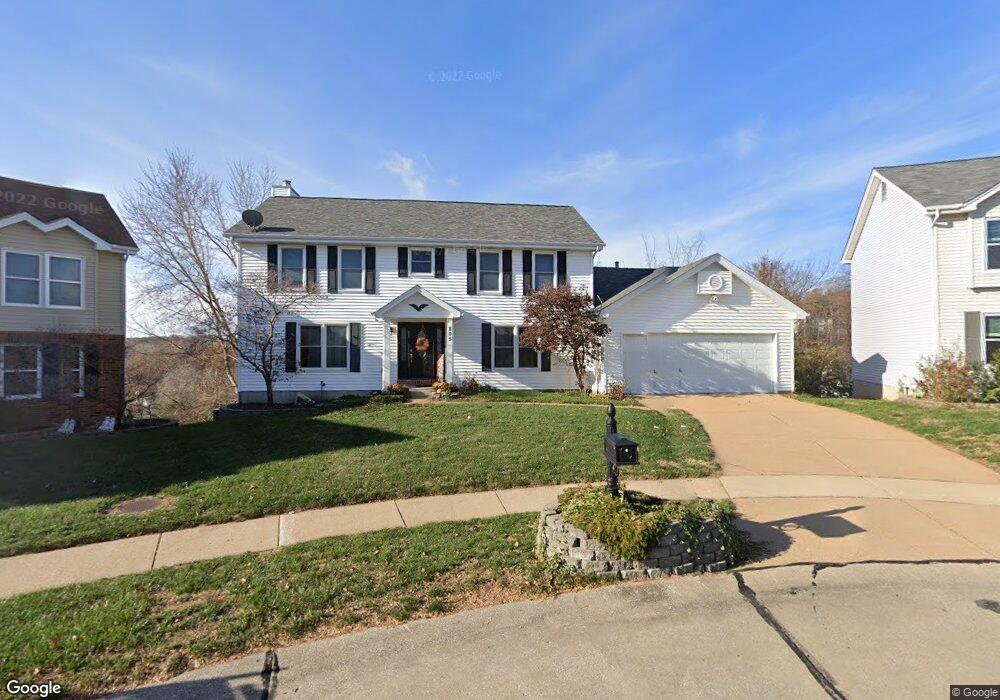
805 Ivy Trace Ballwin, MO 63021
Estimated Value: $470,179 - $566,000
4
Beds
3
Baths
2,494
Sq Ft
$209/Sq Ft
Est. Value
About This Home
This home is located at 805 Ivy Trace, Ballwin, MO 63021 and is currently estimated at $521,045, approximately $208 per square foot. 805 Ivy Trace is a home located in St. Louis County with nearby schools including Wren Hollow Elementary School, Parkway Southwest Middle School, and Parkway South High School.
Ownership History
Date
Name
Owned For
Owner Type
Purchase Details
Closed on
May 9, 2013
Sold by
Joest Michael S Revocable Living
Bought by
Randall Herschell and Randall Erica
Current Estimated Value
Home Financials for this Owner
Home Financials are based on the most recent Mortgage that was taken out on this home.
Original Mortgage
$276,000
Outstanding Balance
$193,600
Interest Rate
3.56%
Mortgage Type
VA
Estimated Equity
$327,445
Purchase Details
Closed on
Apr 15, 2009
Sold by
Joest Michael S and Joest Diane R
Bought by
Joest Michael S and Joest Diane R
Purchase Details
Closed on
Jun 5, 1996
Sold by
Djr Watts James and Djr Amy A
Bought by
Joest Mike S and Joest Diane R
Home Financials for this Owner
Home Financials are based on the most recent Mortgage that was taken out on this home.
Original Mortgage
$132,600
Interest Rate
6.5%
Create a Home Valuation Report for This Property
The Home Valuation Report is an in-depth analysis detailing your home's value as well as a comparison with similar homes in the area
Home Values in the Area
Average Home Value in this Area
Purchase History
| Date | Buyer | Sale Price | Title Company |
|---|---|---|---|
| Randall Herschell | -- | -- | |
| Joest Michael S | -- | None Available | |
| Joest Mike S | -- | -- |
Source: Public Records
Mortgage History
| Date | Status | Borrower | Loan Amount |
|---|---|---|---|
| Open | Randall Herschell | $276,000 | |
| Previous Owner | Joest Mike S | $132,600 |
Source: Public Records
Tax History
| Year | Tax Paid | Tax Assessment Tax Assessment Total Assessment is a certain percentage of the fair market value that is determined by local assessors to be the total taxable value of land and additions on the property. | Land | Improvement |
|---|---|---|---|---|
| 2025 | $5,325 | $84,400 | $32,620 | $51,780 |
| 2024 | $5,325 | $73,710 | $21,760 | $51,950 |
| 2023 | $5,251 | $73,710 | $21,760 | $51,950 |
| 2022 | $4,636 | $58,960 | $19,550 | $39,410 |
| 2021 | $4,604 | $58,960 | $19,550 | $39,410 |
| 2020 | $4,366 | $53,650 | $16,280 | $37,370 |
| 2019 | $4,209 | $53,650 | $16,280 | $37,370 |
| 2018 | $4,010 | $50,860 | $16,280 | $34,580 |
| 2017 | $3,966 | $50,860 | $16,280 | $34,580 |
| 2016 | $3,943 | $48,230 | $12,220 | $36,010 |
Source: Public Records
Map
Nearby Homes
- 1716 Whispering Creek Dr Unit C
- 1450 Whispering Creek Dr Unit 5B
- 1057 Hidden Ridge Trail
- 1565 Glenn Brooke Woods Cir
- 706 Eaglebrooke Dr
- 22 Morning Hill Dr Unit 204
- 709 Ginger Wood Ct
- 1316 Westbrooke Terrace Dr
- 809 Crescent Ridge Dr
- 1034 Alpine Ridge Dr Unit G5
- 1408 Summertree Springs Ave Unit L
- 1337 Stone Run Dr
- 1300 Tahoe Valley Ct
- 1622 Forest Springs Ln Unit A
- 1626 Forest Springs Ln Unit C
- 1340 Holgate Dr Unit G3
- 702 Lofty Point Dr Unit C
- 1332 Holgate Dr Unit G5
- 1327 Holgate Dr Unit C
- 711 Lofty Point Dr Unit C
- 809 Ivy Trace
- 801 Ivy Trace
- 1438 Carriage Bridge Trail
- 1432 Carriage Bridge Trail
- 815 Ivy Trace
- 800 Ivy Trace
- 1444 Carriage Bridge Trail
- 1426 Carriage Bridge Trail
- 819 Ivy Trace
- 1724 Whispering Creek Dr Unit C
- 1724 Whispering Creek Dr Unit B
- 1724 Whispering Creek Dr Unit D
- 1716 Whispering Creek Dr Unit A
- 1716 Whispering Creek Dr Unit B
- 1716 Whispering Creek Dr Unit D
- 808 Ivy Trace
- 1450 Carriage Bridge Trail
- 814 Ivy Trace
- 1420 Carriage Bridge Trail
- 823 Ivy Trace
Your Personal Tour Guide
Ask me questions while you tour the home.