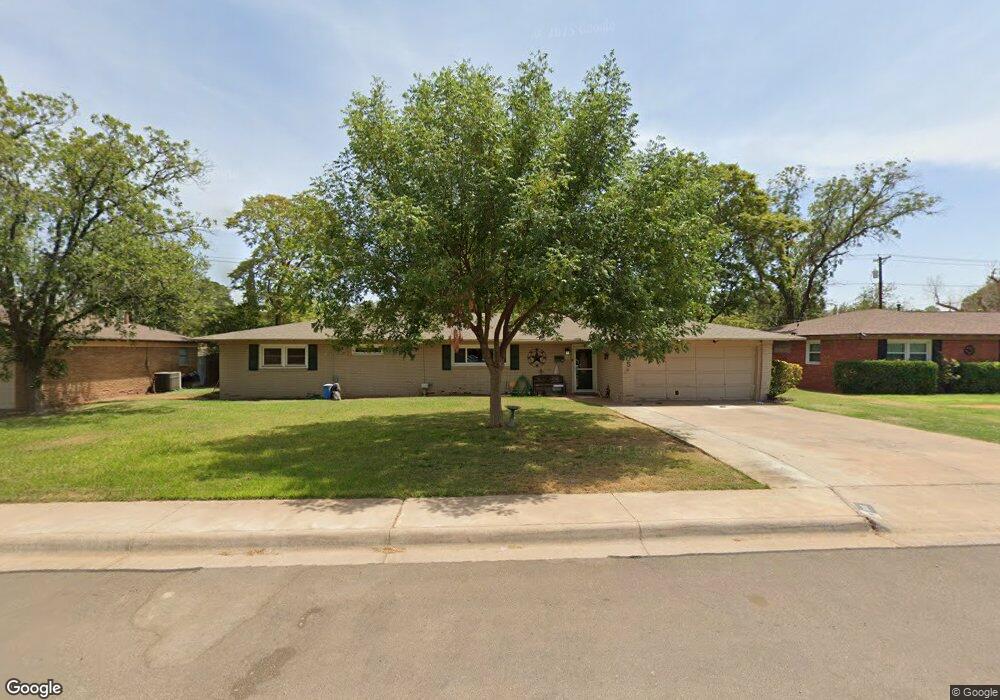
805 Lawson Ave Midland, TX 79701
Estimated Value: $338,330 - $361,000
3
Beds
2
Baths
2,120
Sq Ft
$165/Sq Ft
Est. Value
About This Home
This home is located at 805 Lawson Ave, Midland, TX 79701 and is currently estimated at $350,833, approximately $165 per square foot. 805 Lawson Ave is a home located in Midland County with nearby schools including Midland High School, Sam Houston Collegiate Preparatory Elementary School, and Bowie Fine Arts Academy.
Ownership History
Date
Name
Owned For
Owner Type
Purchase Details
Closed on
Oct 27, 2016
Sold by
Lynch Gay Joyce
Bought by
Lynch Gay Joyce
Current Estimated Value
Purchase Details
Closed on
May 17, 2005
Sold by
Tevis Brenda G
Bought by
Lynch Gay J and Lynch Richard H
Home Financials for this Owner
Home Financials are based on the most recent Mortgage that was taken out on this home.
Original Mortgage
$76,000
Interest Rate
5.83%
Mortgage Type
New Conventional
Purchase Details
Closed on
Nov 6, 2002
Sold by
Powell Elmer Corbin
Bought by
Lynch Gay Joyce
Purchase Details
Closed on
Sep 10, 1997
Bought by
Lynch Gay Joyce
Purchase Details
Closed on
Aug 1, 1990
Bought by
Lynch Gay Joyce
Purchase Details
Closed on
Nov 1, 1989
Bought by
Lynch Gay Joyce
Purchase Details
Closed on
Sep 5, 1989
Bought by
Lynch Gay Joyce
Purchase Details
Closed on
Jun 1, 1983
Bought by
Lynch Gay Joyce
Create a Home Valuation Report for This Property
The Home Valuation Report is an in-depth analysis detailing your home's value as well as a comparison with similar homes in the area
Home Values in the Area
Average Home Value in this Area
Purchase History
| Date | Buyer | Sale Price | Title Company |
|---|---|---|---|
| Lynch Gay Joyce | -- | -- | |
| Lynch Gay J | -- | None Available | |
| Lynch Gay Joyce | -- | -- | |
| Lynch Gay Joyce | -- | -- | |
| Lynch Gay Joyce | -- | -- | |
| Lynch Gay Joyce | -- | -- | |
| Lynch Gay Joyce | -- | -- | |
| Lynch Gay Joyce | -- | -- |
Source: Public Records
Mortgage History
| Date | Status | Borrower | Loan Amount |
|---|---|---|---|
| Previous Owner | Lynch Gay J | $76,000 |
Source: Public Records
Tax History Compared to Growth
Tax History
| Year | Tax Paid | Tax Assessment Tax Assessment Total Assessment is a certain percentage of the fair market value that is determined by local assessors to be the total taxable value of land and additions on the property. | Land | Improvement |
|---|---|---|---|---|
| 2025 | $2,518 | $236,550 | $28,380 | $208,170 |
| 2024 | $2,523 | $257,170 | $28,380 | $228,790 |
| 2023 | $2,771 | $259,200 | $28,380 | $230,820 |
| 2022 | $3,692 | $236,300 | $28,380 | $207,920 |
| 2021 | $3,944 | $230,470 | $28,380 | $202,090 |
| 2020 | $3,036 | $205,830 | $28,380 | $177,450 |
| 2019 | $3,664 | $193,540 | $28,380 | $177,450 |
| 2018 | $3,421 | $175,950 | $28,380 | $147,570 |
| 2017 | $3,155 | $162,260 | $28,380 | $133,880 |
| 2016 | $3,136 | $161,010 | $28,380 | $132,630 |
| 2015 | -- | $162,260 | $28,380 | $133,880 |
| 2014 | -- | $155,780 | $28,380 | $127,400 |
Source: Public Records
Map
Nearby Homes
- 801 W Golf Course Rd
- 1609 N C St
- 800 Other Ave
- 809 Sinclair Ave
- 710 W Nobles Ave
- TBD Bonham St
- 1000 Sinclair Ave
- 1805 N D St
- 205 Club Dr
- 5709 E County Road 94
- 1200 W Scharbauer Dr
- 1202 W Scharbauer Dr
- 1210 W Scharbauer Dr
- 716 Melton Alley
- 705 Melton Alley
- 1202 Country Club Dr
- 1000 W Cuthbert Ave
- 404 W Jax Ave
- 600 Liddon Ave Unit 48
- 600 Liddon Ave Unit 80
- 803 Lawson Ave
- 807 Lawson Ave
- 804 Elk Ave
- 802 Elk Ave
- 809 Lawson Ave
- 806 Elk Ave
- 806 Lawson Ave
- 804 Lawson Ave
- 808 Lawson Ave
- 800 Elk Ave
- 802 Lawson Ave
- 808 Elk Ave
- 811 Lawson Ave
- 810 Lawson Ave
- 800 Lawson Ave
- 810 Elk Ave
- 805 W Golf Course Rd
- 807 W Golf Course Rd
- 803 W Golf Course Rd
- 809 W Golf Course Rd