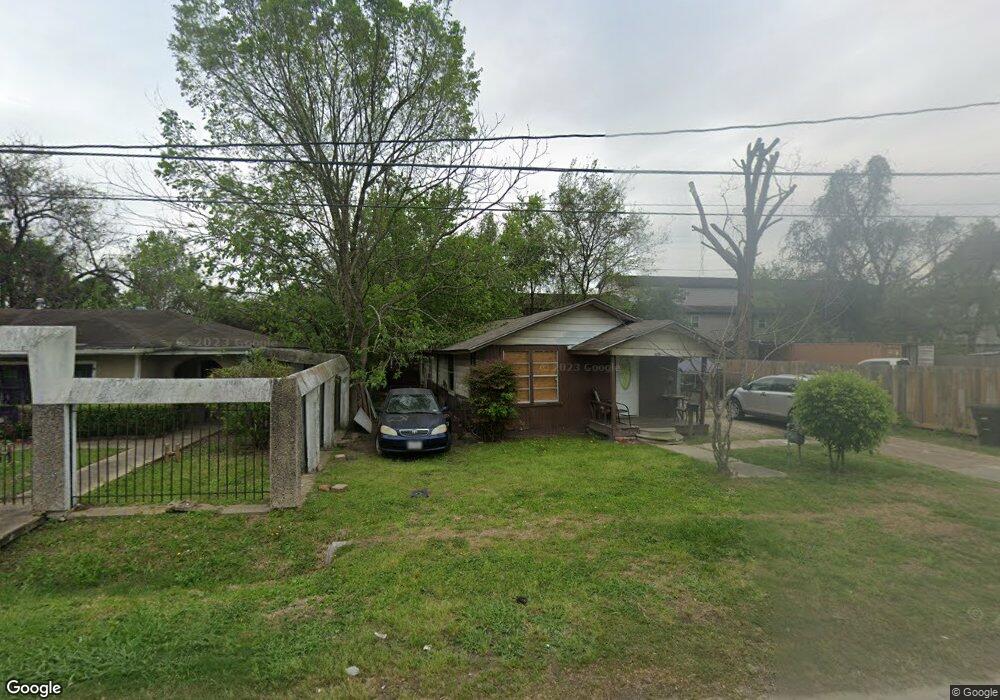
805 Lucky St Houston, TX 77088
Acres Homes NeighborhoodEstimated Value: $160,290 - $210,000
2
Beds
1
Bath
1,380
Sq Ft
$134/Sq Ft
Est. Value
About This Home
This home is located at 805 Lucky St, Houston, TX 77088 and is currently estimated at $184,323, approximately $133 per square foot. 805 Lucky St is a home located in Harris County with nearby schools including Wesley Elementary School, Williams Middle, and Booker T Washington Sr High.
Ownership History
Date
Name
Owned For
Owner Type
Purchase Details
Closed on
Apr 24, 2018
Sold by
Flower Path Investments Lp
Bought by
Arredondo Almita Linda
Current Estimated Value
Home Financials for this Owner
Home Financials are based on the most recent Mortgage that was taken out on this home.
Original Mortgage
$81,000
Interest Rate
4.5%
Mortgage Type
Purchase Money Mortgage
Purchase Details
Closed on
Dec 5, 2017
Sold by
Mirzig Scott
Bought by
Invetsmnet Florrepath
Create a Home Valuation Report for This Property
The Home Valuation Report is an in-depth analysis detailing your home's value as well as a comparison with similar homes in the area
Home Values in the Area
Average Home Value in this Area
Purchase History
| Date | Buyer | Sale Price | Title Company |
|---|---|---|---|
| Arredondo Almita Linda | -- | None Available | |
| Invetsmnet Florrepath | $33,750 | None Available |
Source: Public Records
Mortgage History
| Date | Status | Borrower | Loan Amount |
|---|---|---|---|
| Previous Owner | Arredondo Almita Linda | $81,000 |
Source: Public Records
Tax History Compared to Growth
Tax History
| Year | Tax Paid | Tax Assessment Tax Assessment Total Assessment is a certain percentage of the fair market value that is determined by local assessors to be the total taxable value of land and additions on the property. | Land | Improvement |
|---|---|---|---|---|
| 2025 | $877 | $102,000 | $73,062 | $28,938 |
| 2024 | $877 | $102,638 | $73,062 | $29,576 |
| 2023 | $877 | $102,638 | $73,062 | $29,576 |
| 2022 | $1,625 | $90,628 | $57,024 | $33,604 |
| 2021 | $1,564 | $70,646 | $37,422 | $33,224 |
| 2020 | $1,477 | $64,153 | $32,076 | $32,077 |
| 2019 | $1,559 | $61,617 | $28,512 | $33,105 |
| 2018 | $1,199 | $47,373 | $16,038 | $31,335 |
| 2017 | $1,029 | $40,713 | $10,692 | $30,021 |
| 2016 | $1,029 | $40,713 | $10,692 | $30,021 |
| 2015 | $686 | $41,893 | $10,692 | $31,201 |
| 2014 | $686 | $41,893 | $10,692 | $31,201 |
Source: Public Records
Map
Nearby Homes