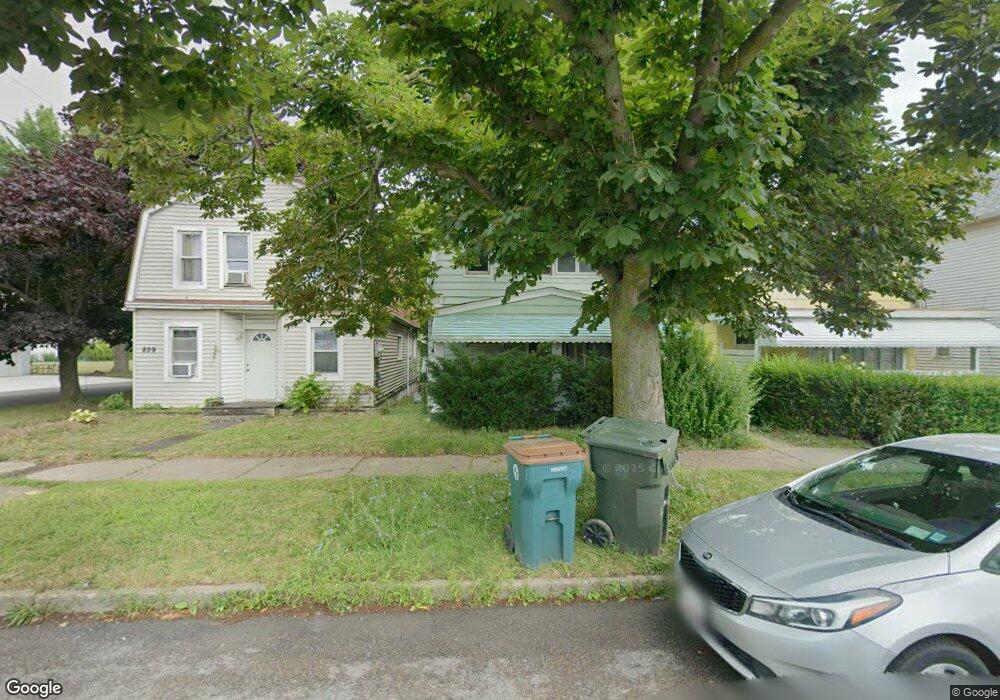
805 Oliver St North Tonawanda, NY 14120
Estimated Value: $147,970 - $166,000
5
Beds
2
Baths
1,684
Sq Ft
$93/Sq Ft
Est. Value
About This Home
This home is located at 805 Oliver St, North Tonawanda, NY 14120 and is currently estimated at $156,243, approximately $92 per square foot. 805 Oliver St is a home located in Niagara County with nearby schools including North Tonawanda Intermediate School, St Matthew Lutheran School, and St. John Lutheran School.
Ownership History
Date
Name
Owned For
Owner Type
Purchase Details
Closed on
May 6, 2019
Sold by
Equity Trust Company
Bought by
Gomez Jesus A and Gomez Christine C
Current Estimated Value
Home Financials for this Owner
Home Financials are based on the most recent Mortgage that was taken out on this home.
Original Mortgage
$54,000
Outstanding Balance
$47,381
Interest Rate
4.1%
Mortgage Type
New Conventional
Estimated Equity
$108,863
Purchase Details
Closed on
Aug 25, 2006
Sold by
Blarr Paul
Bought by
Rice Koreen
Purchase Details
Closed on
Jun 10, 1998
Sold by
March Emily S
Bought by
Blarr Paul J
Create a Home Valuation Report for This Property
The Home Valuation Report is an in-depth analysis detailing your home's value as well as a comparison with similar homes in the area
Home Values in the Area
Average Home Value in this Area
Purchase History
| Date | Buyer | Sale Price | Title Company |
|---|---|---|---|
| Gomez Jesus A | $74,500 | Chicago Title Insurance Co | |
| Rice Koreen | $43,001 | Louis Cacciato | |
| Blarr Paul J | $43,460 | -- |
Source: Public Records
Mortgage History
| Date | Status | Borrower | Loan Amount |
|---|---|---|---|
| Open | Gomez Jesus A | $54,000 |
Source: Public Records
Tax History Compared to Growth
Tax History
| Year | Tax Paid | Tax Assessment Tax Assessment Total Assessment is a certain percentage of the fair market value that is determined by local assessors to be the total taxable value of land and additions on the property. | Land | Improvement |
|---|---|---|---|---|
| 2024 | $1,854 | $52,500 | $8,600 | $43,900 |
| 2023 | $1,808 | $52,500 | $8,600 | $43,900 |
| 2022 | $1,788 | $52,500 | $8,600 | $43,900 |
| 2021 | $1,776 | $52,500 | $8,600 | $43,900 |
| 2020 | $1,739 | $52,500 | $8,600 | $43,900 |
| 2019 | $894 | $52,500 | $8,600 | $43,900 |
| 2018 | $1,732 | $52,500 | $8,600 | $43,900 |
| 2017 | $1,707 | $52,500 | $8,600 | $43,900 |
| 2016 | $1,676 | $52,500 | $8,600 | $43,900 |
| 2015 | -- | $52,500 | $8,600 | $43,900 |
| 2014 | -- | $52,500 | $8,600 | $43,900 |
Source: Public Records
Map
Nearby Homes