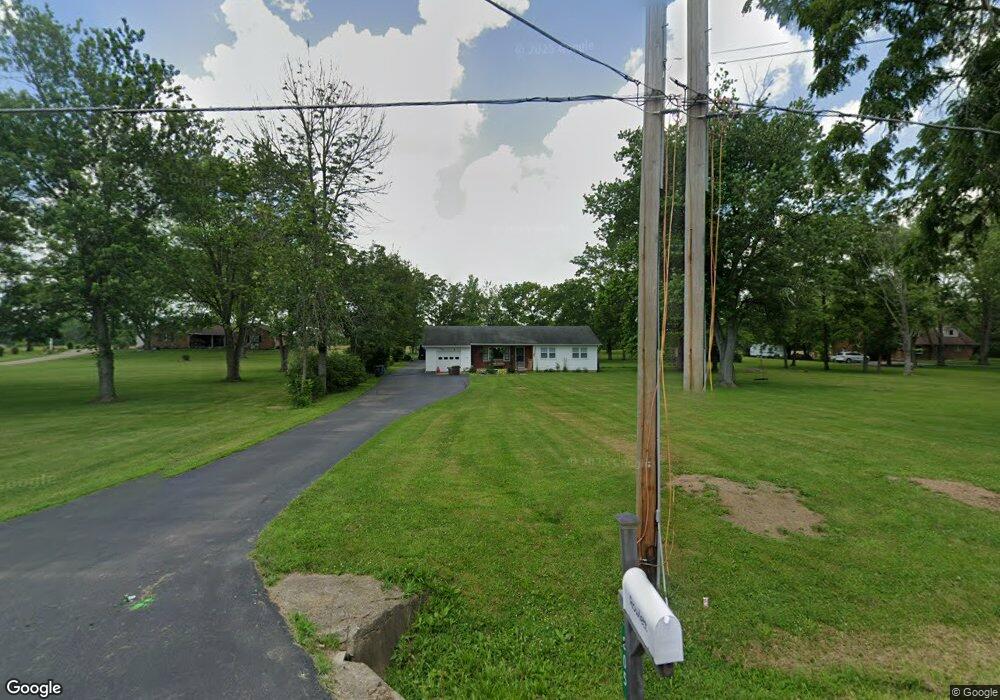
805 S Clayton Rd New Lebanon, OH 45345
Estimated Value: $161,000 - $243,000
3
Beds
1
Bath
1,340
Sq Ft
$149/Sq Ft
Est. Value
About This Home
This home is located at 805 S Clayton Rd, New Lebanon, OH 45345 and is currently estimated at $200,250, approximately $149 per square foot. 805 S Clayton Rd is a home located in Montgomery County with nearby schools including Dixie Elementary School, Dixie Middle School, and Dixie High School.
Ownership History
Date
Name
Owned For
Owner Type
Purchase Details
Closed on
Sep 15, 2020
Sold by
Adamson Robin E
Bought by
Rowlett Mitchell A and Rowlett Brianna M
Current Estimated Value
Purchase Details
Closed on
Apr 8, 2019
Sold by
Peffly Andrew David
Bought by
Adamson Robin E
Home Financials for this Owner
Home Financials are based on the most recent Mortgage that was taken out on this home.
Original Mortgage
$89,000
Interest Rate
4.4%
Mortgage Type
New Conventional
Purchase Details
Closed on
Dec 9, 2016
Sold by
Tietge James and Tietge Toby A
Bought by
Peffly Andrew David and Peffly Robin E
Home Financials for this Owner
Home Financials are based on the most recent Mortgage that was taken out on this home.
Original Mortgage
$92,150
Interest Rate
3.94%
Mortgage Type
New Conventional
Purchase Details
Closed on
Dec 26, 2008
Sold by
Fox Marcie L
Bought by
Tietge James
Create a Home Valuation Report for This Property
The Home Valuation Report is an in-depth analysis detailing your home's value as well as a comparison with similar homes in the area
Home Values in the Area
Average Home Value in this Area
Purchase History
| Date | Buyer | Sale Price | Title Company |
|---|---|---|---|
| Rowlett Mitchell A | $90,000 | None Available | |
| Adamson Robin E | -- | Sterling Land Title Agcy Inc | |
| Peffly Andrew David | $97,000 | Landmark Title Agency South | |
| Tietge James | $75,000 | Attorney |
Source: Public Records
Mortgage History
| Date | Status | Borrower | Loan Amount |
|---|---|---|---|
| Previous Owner | Adamson Robin E | $89,000 | |
| Previous Owner | Peffly Andrew David | $92,150 |
Source: Public Records
Tax History Compared to Growth
Tax History
| Year | Tax Paid | Tax Assessment Tax Assessment Total Assessment is a certain percentage of the fair market value that is determined by local assessors to be the total taxable value of land and additions on the property. | Land | Improvement |
|---|---|---|---|---|
| 2024 | $2,940 | $60,500 | $29,810 | $30,690 |
| 2023 | $2,940 | $60,500 | $29,810 | $30,690 |
| 2022 | $2,484 | $40,260 | $19,870 | $20,390 |
| 2021 | $2,505 | $40,260 | $19,870 | $20,390 |
| 2020 | $2,398 | $40,260 | $19,870 | $20,390 |
| 2019 | $1,802 | $28,520 | $19,870 | $8,650 |
| 2018 | $1,810 | $28,520 | $19,870 | $8,650 |
| 2017 | $1,738 | $28,520 | $19,870 | $8,650 |
| 2016 | $1,665 | $27,550 | $16,560 | $10,990 |
| 2015 | $1,631 | $27,550 | $16,560 | $10,990 |
| 2014 | $1,631 | $30,110 | $16,560 | $13,550 |
| 2012 | -- | $26,250 | $18,950 | $7,300 |
Source: Public Records
Map
Nearby Homes
- 660 Cranwood Cir
- 731 Homeway Dr
- 432 Scarborough Ct
- 448 Gregory Ave
- 630 Holderman Place
- 431 Avon Oak Ct
- 404 S Fuls Rd
- 221 Mills Place
- 107 Laredo Ave
- 231 S Church St
- 213 S Church St
- 115 N Clayton Rd
- 0 Dayton Eaton Pike Unit 1834498
- 2135 Dayton Eaton Pike
- 1750 Fuls Rd
- 1204 Sizemore Ct
- 136 Bronwood St
- 1200 W Main St
- 109 E Main St
- 224 Drina Ave
- 845 S Clayton Rd
- 775 S Clayton Rd
- 780 S Clayton Rd
- 907 S Clayton Rd
- 934 S Clayton Rd
- 700 S Clayton Rd
- 943 S Clayton Rd
- 808 S Clayton Rd Unit Lot 9
- 808 S Clayton Rd
- 11625 Mile Rd
- 11655 Mile Rd
- 621 S Clayton Rd
- 11685 Mile Rd
- 420 Waite Ave
- 430 Waite Ave
- 11436 Mile Rd
- 440 Waite Ave
- 416 Waite Ave
- 11568 Mile Rd
- 11421 Mile Rd