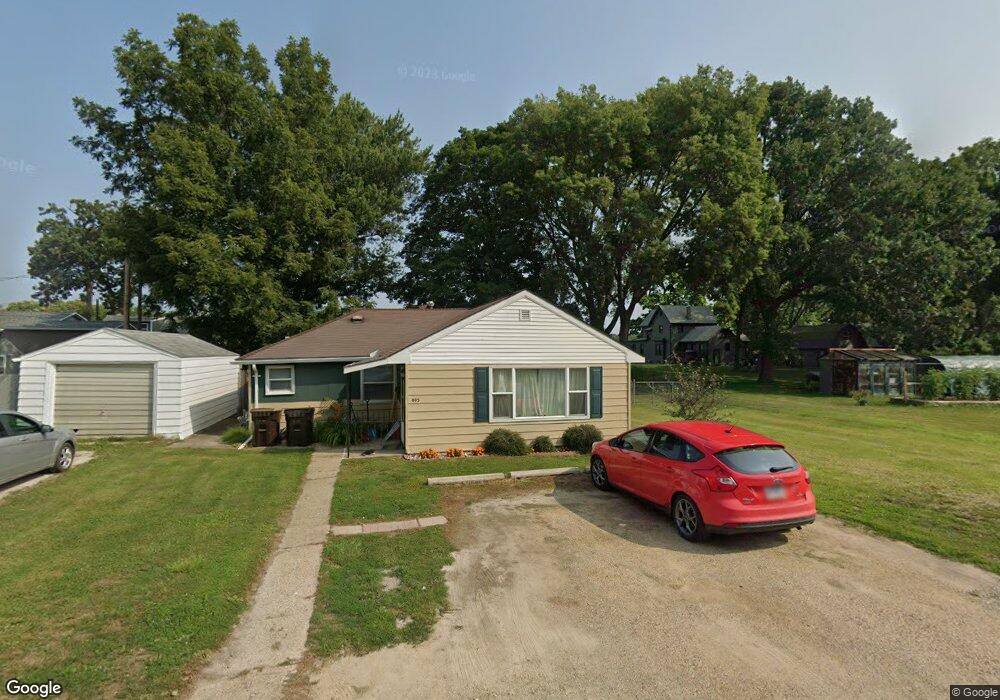
805 Thome Ct Rock Falls, IL 61071
Estimated Value: $55,000 - $103,000
--
Bed
--
Bath
--
Sq Ft
6,970
Sq Ft Lot
About This Home
This home is located at 805 Thome Ct, Rock Falls, IL 61071 and is currently estimated at $73,764. 805 Thome Ct is a home located in Whiteside County with nearby schools including Merrill Elementary School, Dillon Elementary School, and Rock Falls Middle School.
Ownership History
Date
Name
Owned For
Owner Type
Purchase Details
Closed on
Aug 29, 2025
Sold by
Fritz Frank V and Fritz Jeri Lynne
Bought by
Cortes Sarita A
Current Estimated Value
Home Financials for this Owner
Home Financials are based on the most recent Mortgage that was taken out on this home.
Original Mortgage
$39,400
Outstanding Balance
$39,400
Interest Rate
6.74%
Mortgage Type
New Conventional
Estimated Equity
$34,364
Purchase Details
Closed on
Jun 15, 2005
Sold by
Roe Larry and Roe Brenda
Bought by
Fritz Frank and Fritz Jeri Lynne
Create a Home Valuation Report for This Property
The Home Valuation Report is an in-depth analysis detailing your home's value as well as a comparison with similar homes in the area
Home Values in the Area
Average Home Value in this Area
Purchase History
| Date | Buyer | Sale Price | Title Company |
|---|---|---|---|
| Cortes Sarita A | $50,000 | None Listed On Document | |
| Fritz Frank | $24,000 | None Available |
Source: Public Records
Mortgage History
| Date | Status | Borrower | Loan Amount |
|---|---|---|---|
| Open | Cortes Sarita A | $39,400 |
Source: Public Records
Tax History Compared to Growth
Tax History
| Year | Tax Paid | Tax Assessment Tax Assessment Total Assessment is a certain percentage of the fair market value that is determined by local assessors to be the total taxable value of land and additions on the property. | Land | Improvement |
|---|---|---|---|---|
| 2024 | $1,968 | $17,943 | $3,630 | $14,313 |
| 2023 | $1,856 | $16,548 | $3,348 | $13,200 |
| 2022 | $1,804 | $15,603 | $3,157 | $12,446 |
| 2021 | $1,735 | $14,762 | $2,987 | $11,775 |
| 2020 | $1,737 | $14,510 | $2,936 | $11,574 |
| 2019 | $1,645 | $13,991 | $2,831 | $11,160 |
| 2018 | $1,483 | $13,679 | $2,768 | $10,911 |
| 2017 | $1,482 | $12,932 | $2,716 | $10,216 |
| 2016 | $1,454 | $12,714 | $2,670 | $10,044 |
| 2015 | $1,107 | $10,303 | $2,805 | $7,498 |
| 2014 | $110 | $10,028 | $2,730 | $7,298 |
| 2013 | $1,107 | $10,303 | $2,805 | $7,498 |
Source: Public Records
Map
Nearby Homes