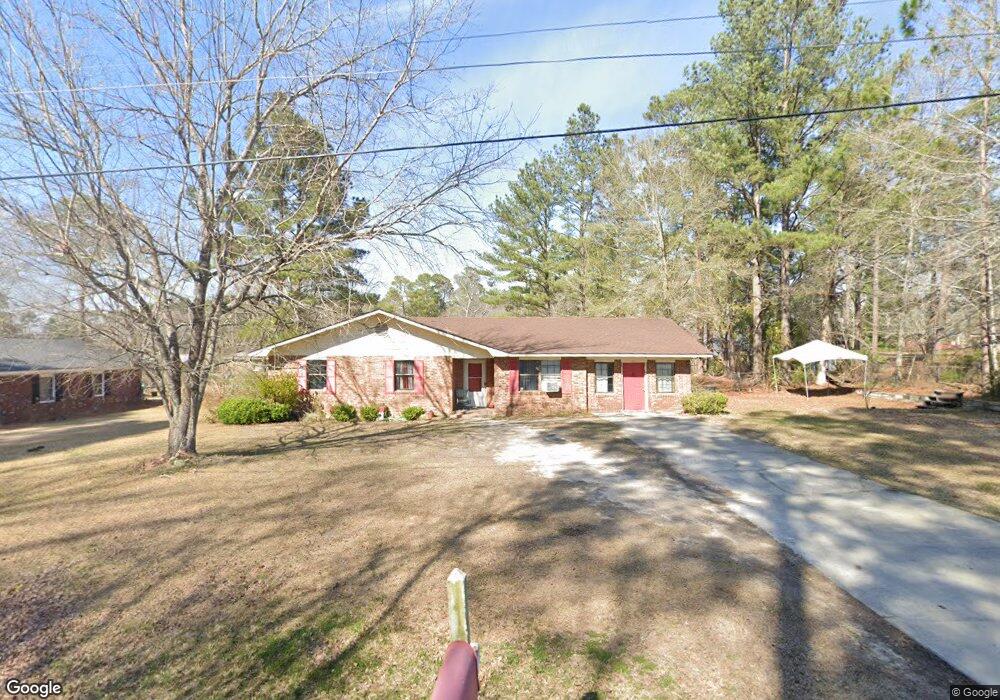
805 W James St Claxton, GA 30417
Estimated Value: $116,000 - $189,000
3
Beds
2
Baths
1,743
Sq Ft
$89/Sq Ft
Est. Value
About This Home
This home is located at 805 W James St, Claxton, GA 30417 and is currently estimated at $155,858, approximately $89 per square foot. 805 W James St is a home located in Evans County with nearby schools including Claxton Elementary School, Second Chance, and Claxton Middle School.
Ownership History
Date
Name
Owned For
Owner Type
Purchase Details
Closed on
Oct 3, 2019
Sold by
Us Bank National Association Trustee
Bought by
Nrz Reo V B Llc
Current Estimated Value
Purchase Details
Closed on
Jun 1, 2019
Sold by
Williams Carron D
Bought by
Us Bank National Association
Purchase Details
Closed on
Dec 6, 2005
Sold by
Not Provided
Bought by
Mortgage Electronic Registrati and Homecomings Financial Jp Morga
Purchase Details
Closed on
Oct 14, 2003
Sold by
Williams Mary A
Bought by
Williams Carron D
Purchase Details
Closed on
Sep 30, 1999
Sold by
Hayman Sonja Denise
Bought by
Williams Mary A
Purchase Details
Closed on
May 5, 1999
Sold by
Hayman Wilmer Tyson
Bought by
Hayman Sonja Denise
Purchase Details
Closed on
Jun 14, 1995
Sold by
Pinckard Becky B
Bought by
Hayman Wilmer Tyson and Sonja Denise
Create a Home Valuation Report for This Property
The Home Valuation Report is an in-depth analysis detailing your home's value as well as a comparison with similar homes in the area
Home Values in the Area
Average Home Value in this Area
Purchase History
| Date | Buyer | Sale Price | Title Company |
|---|---|---|---|
| Nrz Reo V B Llc | -- | -- | |
| Us Bank National Association | -- | -- | |
| Mortgage Electronic Registrati | $58,141 | -- | |
| Mtg Electronic Registration Sy | $58,141 | -- | |
| Williams Carron D | -- | -- | |
| Williams Mary A | $64,500 | -- | |
| Hayman Sonja Denise | -- | -- | |
| Hayman Wilmer Tyson | $55,000 | -- |
Source: Public Records
Tax History Compared to Growth
Tax History
| Year | Tax Paid | Tax Assessment Tax Assessment Total Assessment is a certain percentage of the fair market value that is determined by local assessors to be the total taxable value of land and additions on the property. | Land | Improvement |
|---|---|---|---|---|
| 2024 | $1,294 | $53,720 | $4,320 | $49,400 |
| 2023 | $1,204 | $28,160 | $3,200 | $24,960 |
| 2022 | $1,028 | $28,364 | $3,200 | $25,164 |
| 2021 | $912 | $28,364 | $3,200 | $25,164 |
| 2020 | $834 | $28,364 | $3,200 | $25,164 |
| 2019 | $873 | $28,364 | $3,200 | $25,164 |
| 2018 | $862 | $27,924 | $3,200 | $24,724 |
| 2017 | $851 | $28,364 | $3,200 | $25,164 |
| 2016 | $845 | $27,864 | $3,200 | $24,664 |
| 2015 | -- | $28,476 | $3,200 | $25,276 |
| 2014 | -- | $28,476 | $3,200 | $25,276 |
| 2013 | -- | $28,852 | $3,200 | $25,652 |
Source: Public Records
Map
Nearby Homes
- 308 Old Metter Rd
- 0 Dublin Rd
- 610 W Liberty St
- 511 W Smith St
- 6 N Spring St
- 3 S Spring St
- 606 Park Ave
- 0 Turnpike Rd Unit SA339603
- 107 Marguerite St
- 19 Wysteria Ln
- 0 Ga Hwy 129 N Unit 10564606
- 7 Honeysuckle Way
- 9 Honeysuckle Dr
- 201 New Dr
- 10 Honeysuckle Dr
- 7 Honeysuckle Dr
- 3 Honeysuckle Dr
- 12 S Duval St
- 12 Wisteria Ln
- 12 Wysteria Ln
- 807 W James St
- 102 Stewart St
- 810 Womble St
- 812 Womble St
- 108 Stewart St
- 809 W James St
- 101 Stewart St
- 103 Stewart St
- 814 Womble St
- 814 Womble St Unit Lot 18 & 17
- 107 Stewart St
- 805 Womble St
- 811 W James St
- 202 Stewart St
- 807 Womble St
- 818 Womble St
- 102 N College St
- 104 N College St
- 106 N College St
- 202 202 Stewart St