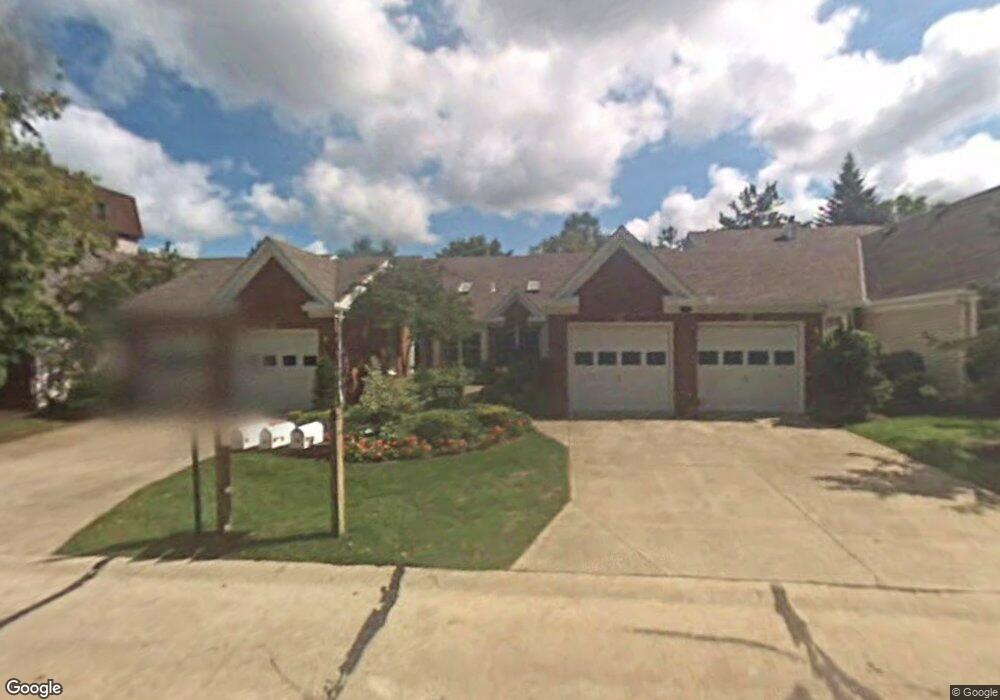
805 Windrush Dr Unit 1 Westlake, OH 44145
Estimated Value: $255,000 - $361,000
2
Beds
3
Baths
1,629
Sq Ft
$202/Sq Ft
Est. Value
About This Home
This home is located at 805 Windrush Dr Unit 1, Westlake, OH 44145 and is currently estimated at $329,441, approximately $202 per square foot. 805 Windrush Dr Unit 1 is a home located in Cuyahoga County with nearby schools including Westlake Elementary School, Dover Intermediate School, and Lee Burneson Middle School.
Ownership History
Date
Name
Owned For
Owner Type
Purchase Details
Closed on
Jul 7, 2022
Sold by
Woodbridge Katharyn L
Bought by
Robison Peter and Robison Maura
Current Estimated Value
Purchase Details
Closed on
Apr 28, 2015
Sold by
Belser Dorothy S
Bought by
Woodbridge Katharyn L
Purchase Details
Closed on
Jun 19, 2014
Sold by
Belser Robert S
Bought by
Belser Dorothy S
Purchase Details
Closed on
Feb 25, 2014
Sold by
Belser Dorothy S
Bought by
Belser Robert S
Purchase Details
Closed on
Jan 8, 2010
Sold by
Ruscher Stephen F
Bought by
Belser Robert S
Purchase Details
Closed on
Oct 19, 2009
Sold by
Estate Of Linda B Ruscher
Bought by
Ruscher Stephen F and Linda B Ruscher Family Trust
Purchase Details
Closed on
Mar 9, 1989
Sold by
Meyer Noreen A
Bought by
Belser Dorothy S
Purchase Details
Closed on
Aug 12, 1988
Sold by
Meyer Samuel E and N A
Bought by
Meyer Noreen A
Purchase Details
Closed on
Jan 1, 1988
Bought by
Meyer Samuel E and N A
Create a Home Valuation Report for This Property
The Home Valuation Report is an in-depth analysis detailing your home's value as well as a comparison with similar homes in the area
Home Values in the Area
Average Home Value in this Area
Purchase History
| Date | Buyer | Sale Price | Title Company |
|---|---|---|---|
| Robison Peter | $307,000 | Mccafferty Joseph P | |
| Woodbridge Katharyn L | $169,900 | Northern Title Agency Inc | |
| Belser Dorothy S | -- | Attorney | |
| Belser Robert S | -- | Attorney | |
| Belser Robert S | $58,900 | Attorney | |
| Ruscher Stephen F | -- | Attorney | |
| Ruscher Stephen F | -- | None Available | |
| Belser Dorothy S | $155,000 | -- | |
| Meyer Noreen A | -- | -- | |
| Meyer Samuel E | -- | -- |
Source: Public Records
Tax History Compared to Growth
Tax History
| Year | Tax Paid | Tax Assessment Tax Assessment Total Assessment is a certain percentage of the fair market value that is determined by local assessors to be the total taxable value of land and additions on the property. | Land | Improvement |
|---|---|---|---|---|
| 2024 | $5,090 | $107,450 | $10,220 | $97,230 |
| 2023 | $4,618 | $83,340 | $8,330 | $75,010 |
| 2022 | $4,544 | $83,340 | $8,330 | $75,010 |
| 2021 | $4,550 | $83,340 | $8,330 | $75,010 |
| 2020 | $3,874 | $65,100 | $6,510 | $58,590 |
| 2019 | $3,757 | $186,000 | $18,600 | $167,400 |
| 2018 | $1,887 | $65,100 | $6,510 | $58,590 |
| 2017 | $3,481 | $56,490 | $4,690 | $51,800 |
| 2016 | $3,463 | $56,490 | $4,690 | $51,800 |
| 2015 | $3,444 | $56,490 | $4,690 | $51,800 |
| 2014 | -- | $55,590 | $5,570 | $50,020 |
Source: Public Records
Map
Nearby Homes
- 851 Brick Mill Run Unit 10
- 700 Brick Mill Run Unit 406
- 22576 Peach Tree Ln
- 1330 E Melrose Dr
- 1301 Clague Rd
- 7 Pond Dr
- 22722 Lake Rd
- 22728 Lake Rd
- 23200 Lake Rd Unit 50
- 23200 Lake Rd Unit 47
- 23200 Lake Rd Unit 30
- 1055 Medfield Dr
- 421 Darbys Run
- 22700 Lake Rd Unit 204
- 22700 Lake Rd Unit 305
- 22700 Lake Rd Unit 406
- 22700 Lake Rd Unit 306
- 22700 Lake Rd Unit 405
- 22700 Lake Rd Unit 304
- 22700 Lake Rd Unit 504
- 805 Windrush Dr Unit B1
- 805 Windrush Dr
- 805 Windrush Dr Unit A1
- 805 Windrush Dr Unit C-1
- 805 Windrush Dr Unit 805
- 802 Coverly Rd
- 802 Coverly Rd
- 802 Coverly Rd
- 802 Coverly Rd Unit B1
- 802 Coverly Rd Unit A1
- 841 Hamlet Ln
- 841 Hamlet Ln Unit A2
- 841 Hamlet Ln Unit A2S
- 841 Hamlet Ln
- 841 Hamlet Ln
- 841 Hamlet Ln
- 841 Hamlet Ln Unit B1
- 841 Hamlet Ln Unit B2
- 841 Hamlet Ln Unit A-1A
- 23063 Brick Mill Run Unit C-3