80501 Carnahan Rd Arch Cape, OR 97102
Estimated Value: $525,000 - $1,564,000
2
Beds
1
Bath
1,032
Sq Ft
$900/Sq Ft
Est. Value
About This Home
This home is located at 80501 Carnahan Rd, Arch Cape, OR 97102 and is currently estimated at $928,884, approximately $900 per square foot. 80501 Carnahan Rd is a home located in Clatsop County with nearby schools including Seaside High School, The Cannon Beach Academy, and Fire Mountain School.
Ownership History
Date
Name
Owned For
Owner Type
Purchase Details
Closed on
Oct 1, 2024
Sold by
Iggulden Barbara and Iggulden Ronald
Bought by
Iggulden Living Trust and Iggulden
Current Estimated Value
Purchase Details
Closed on
May 6, 2022
Sold by
Hunt Scott N and Phillips Alice
Bought by
Scott N Hunt And Alice P Hunt Revocable Trust
Purchase Details
Closed on
Apr 3, 2019
Sold by
Hunt Scott N
Bought by
Hunt Scott N and Hunt Alice Phillips
Purchase Details
Closed on
May 3, 2017
Sold by
Hunt Douglas L
Bought by
Hunt Scott N
Purchase Details
Closed on
Sep 29, 2011
Sold by
Hango Marion I and Hango Robert H
Bought by
Hango Marion Irene and Marion Irene Hango Revocable Living Trus
Purchase Details
Closed on
Feb 28, 2008
Sold by
Hango Gary L
Bought by
Hango Robert H and Hango Marion I
Purchase Details
Closed on
Jul 24, 2007
Sold by
Hango Eunice O
Bought by
Rafferty Richard and Rafferty Kathryn
Create a Home Valuation Report for This Property
The Home Valuation Report is an in-depth analysis detailing your home's value as well as a comparison with similar homes in the area
Home Values in the Area
Average Home Value in this Area
Purchase History
| Date | Buyer | Sale Price | Title Company |
|---|---|---|---|
| Iggulden Living Trust | -- | None Listed On Document | |
| Iggulden Barbara | -- | None Listed On Document | |
| Scott N Hunt And Alice P Hunt Revocable Trust | -- | Cares Law Pc | |
| Hunt Scott N | -- | None Available | |
| Hunt Scott N | -- | None Available | |
| Hango Marion Irene | -- | None Available | |
| Hango Robert H | $111,250 | None Available | |
| Rafferty Richard | $111,250 | None Available |
Source: Public Records
Tax History Compared to Growth
Tax History
| Year | Tax Paid | Tax Assessment Tax Assessment Total Assessment is a certain percentage of the fair market value that is determined by local assessors to be the total taxable value of land and additions on the property. | Land | Improvement |
|---|---|---|---|---|
| 2024 | $5,329 | $387,220 | -- | -- |
| 2023 | $4,844 | $375,943 | $0 | $0 |
| 2022 | $4,730 | $364,994 | $0 | $0 |
| 2021 | $4,647 | $354,364 | $0 | $0 |
| 2020 | $4,538 | $344,044 | $0 | $0 |
| 2019 | $4,283 | $334,024 | $0 | $0 |
| 2018 | $4,038 | $324,296 | $0 | $0 |
| 2017 | $3,959 | $314,851 | $0 | $0 |
| 2016 | $3,418 | $305,681 | $195,508 | $110,173 |
| 2015 | $3,324 | $296,779 | $189,814 | $106,965 |
| 2014 | $3,250 | $288,136 | $0 | $0 |
| 2013 | -- | $279,745 | $0 | $0 |
Source: Public Records
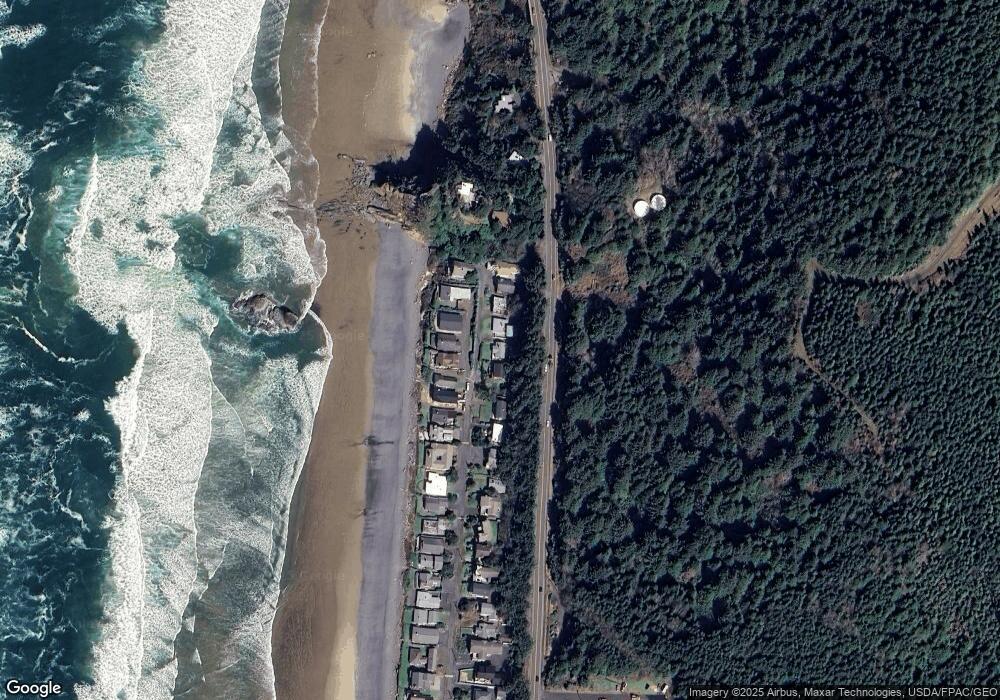
Map
Nearby Homes
- 80444 Carnahan Rd
- 0 Big Cedar Ct Unit Lot 13 25-380
- 0 Big Cedar Ct Unit 25-710
- 0 Big Cedar Ct Unit Lot 13 422540938
- 79906 Greenleaf Rd
- 0 Greenleaf Rd
- 0 Tide Ave
- 32796 Picture Windows Ln
- 79519 Ray Brown Rd
- 31911 Clatsop Ln
- 0 Clatsop Ln Unit 25-693
- 0 Clatsop Ln Unit Lot 408 662114611
- 79274 Ray Brown Rd
- 4463 Pacific Ave
- 116 W Watts Way
- 223 W Kenai St
- 286 W Kenai St
- 4072 S Hemlock St
- 0 Ocean Ave Unit 25-686
- 80493 Carnahan Rd
- 80505 Carnahan Rd
- 80511 Carnahan Rd
- 80502 Carnahan Rd
- 80496 Carnahan Rd
- 80506 Carnahan Rd
- 80487 Carnahan Rd
- 80492 Carnahan Rd
- 80519 Carnahan Rd
- 80512 Carnahan Rd
- 80521 Carnahan Rd
- 80479 Carnahan Rd
- 80484 Carnahan Rd
- 80523 Carnahan Rd
- 80486 Carnahan Rd
- 80471 Carnahan Rd
- 80472 Carnahan Rd
- 80478 Carnahan Rd
- 79856 Highway 101
- 80465 Carnahan Rd