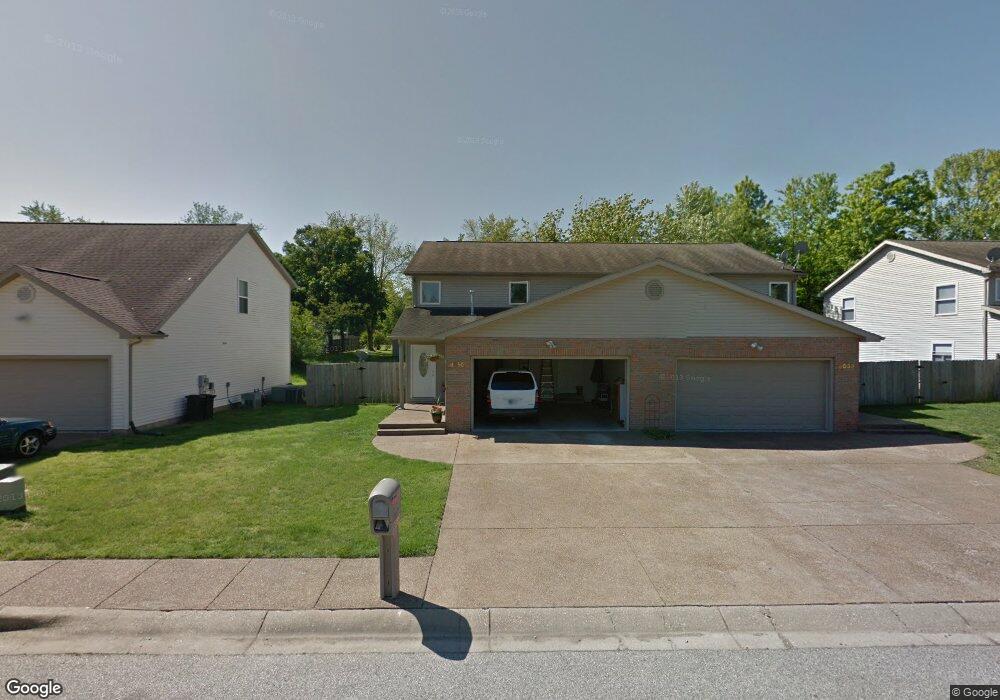
8055 Alexandra Ln Unit 8059 Newburgh, IN 47630
Estimated Value: $310,000 - $368,000
3
Beds
2
Baths
4,434
Sq Ft
$75/Sq Ft
Est. Value
About This Home
This home is located at 8055 Alexandra Ln Unit 8059, Newburgh, IN 47630 and is currently estimated at $334,434, approximately $75 per square foot. 8055 Alexandra Ln Unit 8059 is a home located in Warrick County with nearby schools including Sharon Elementary School, Castle South Middle School, and Castle High School.
Ownership History
Date
Name
Owned For
Owner Type
Purchase Details
Closed on
Dec 14, 2022
Sold by
Winchester Mark A and Winchester Kendra B
Bought by
Mkw1 Llc
Current Estimated Value
Purchase Details
Closed on
Apr 27, 2022
Sold by
Oow Properties Llc
Bought by
Winchester Mark A and Winchester Kendra B
Home Financials for this Owner
Home Financials are based on the most recent Mortgage that was taken out on this home.
Original Mortgage
$249,600
Interest Rate
3.39%
Mortgage Type
New Conventional
Purchase Details
Closed on
Nov 2, 2007
Sold by
Washington Baptist Church Of Vanderburgh
Bought by
Washington Avenue Baptist Church
Purchase Details
Closed on
Apr 30, 2007
Sold by
Sun Rise Manor Llp
Bought by
Graybill John M and Dannheiser Leesa
Home Financials for this Owner
Home Financials are based on the most recent Mortgage that was taken out on this home.
Original Mortgage
$164,020
Interest Rate
6.2%
Mortgage Type
Unknown
Create a Home Valuation Report for This Property
The Home Valuation Report is an in-depth analysis detailing your home's value as well as a comparison with similar homes in the area
Home Values in the Area
Average Home Value in this Area
Purchase History
| Date | Buyer | Sale Price | Title Company |
|---|---|---|---|
| Mkw1 Llc | -- | None Listed On Document | |
| Winchester Mark A | $312,000 | None Listed On Document | |
| Winchester Mark A | $312,000 | Bosse Title Company Llc | |
| Washington Avenue Baptist Church | -- | None Available | |
| Graybill John M | -- | None Available |
Source: Public Records
Mortgage History
| Date | Status | Borrower | Loan Amount |
|---|---|---|---|
| Previous Owner | Winchester Mark A | $249,600 | |
| Previous Owner | Graybill John M | $164,020 |
Source: Public Records
Tax History Compared to Growth
Tax History
| Year | Tax Paid | Tax Assessment Tax Assessment Total Assessment is a certain percentage of the fair market value that is determined by local assessors to be the total taxable value of land and additions on the property. | Land | Improvement |
|---|---|---|---|---|
| 2024 | $2,287 | $157,600 | $7,500 | $150,100 |
| 2023 | $2,345 | $157,600 | $7,500 | $150,100 |
| 2022 | $2,255 | $157,600 | $7,500 | $150,100 |
| 2021 | $2,437 | $154,800 | $7,700 | $147,100 |
| 2020 | $2,379 | $143,300 | $7,500 | $135,800 |
| 2019 | $2,429 | $143,300 | $7,500 | $135,800 |
| 2018 | $2,334 | $143,300 | $7,500 | $135,800 |
| 2017 | $2,320 | $143,300 | $7,500 | $135,800 |
| 2016 | $2,307 | $143,300 | $7,500 | $135,800 |
| 2014 | $2,434 | $159,800 | $24,000 | $135,800 |
| 2013 | $2,339 | $157,100 | $24,000 | $133,100 |
Source: Public Records
Map
Nearby Homes
- 7844 Meadow Ln
- 7811 Ridgemont Dr
- 7766 Meadow Ln
- 7688 Meadow Ln
- 0 Willow Pond Rd
- 7455 Oak Park Dr
- 8633 Outer Lincoln Ave
- 4333 Hilldale Dr
- 5455 E Timberwood Dr
- 8634 Briarose Ct
- 4300 Hilldale Dr
- 7711 Woodland Dr
- 4949 Live Oak Ct
- 5300 Lenn Rd
- 4366 Lenn Rd
- 5599 Victoria Ct
- 8855 Hickory Ln
- 8855 Framewood Dr
- 5512 Abbe Wood Dr
- 5610 Saint Catherine Ct
- 8055 Alexandra Ln
- 8055 Alexandra Ln
- 8059 Alexandra Ln
- 8077 Alexandra Ln
- 8021 Alexandra Ln
- 8011 Alexandra Ln
- 8040 Alexandra Ln
- 8081 Alexandra Ln
- 8030 Alexandra Ln
- 8005 Alexandra Ln
- 8066 Alexandra Ln Unit 8070
- 8020 Alexandra Ln
- 8001 Alexandra Ln
- 8001 Alexandra Ln
- 8001 Alexandra Ln Unit 8005
- 8010 Alexandra Ln
- 8092 Alexandra Ln
- 8088 Alexandra Ln
- 8088 Alexandra Ln Unit 8092
- 8000 Brosend Rd