Estimated Value: $457,506
2
Beds
--
Bath
1,900
Sq Ft
$241/Sq Ft
Est. Value
About This Home
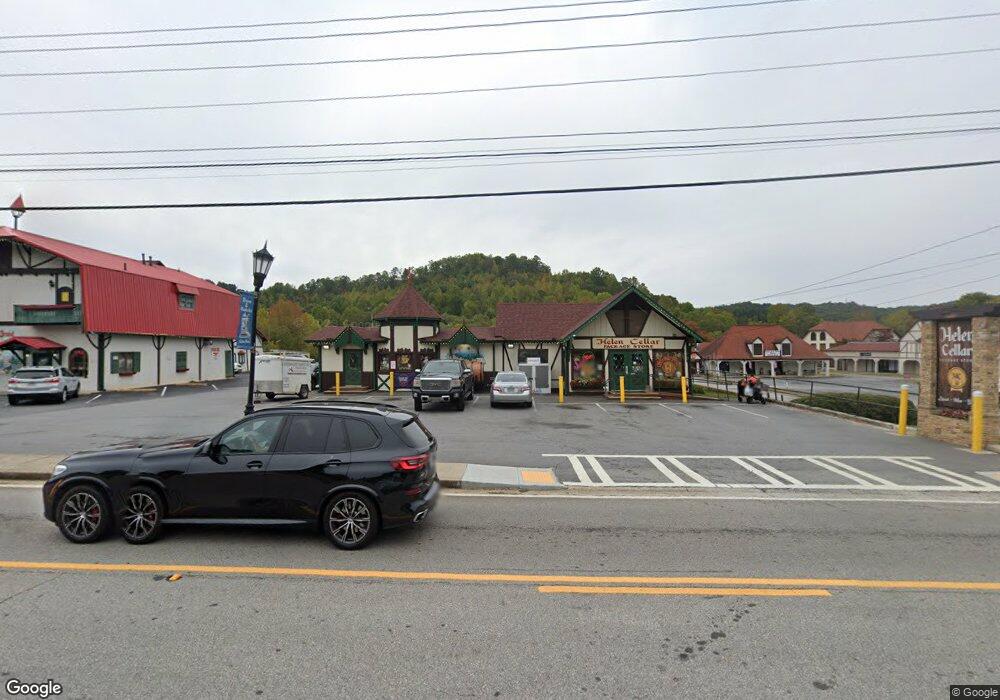
This home is located at 8056 S Main St, Helen, GA 30545 and is currently priced at $457,506, approximately $240 per square foot. 8056 S Main St is a home located in White County with nearby schools including Mount Yonah Elementary School, White County 9th Grade Academy, and White County Middle School.
Ownership History
Date
Name
Owned For
Owner Type
Purchase Details
Closed on
Sep 30, 2015
Sold by
Hanover Tod
Bought by
Max Llc
Current Estimated Value
Purchase Details
Closed on
Sep 18, 2015
Sold by
Five J Rental Llc
Bought by
Hanover Tod
Purchase Details
Closed on
Jun 23, 2011
Sold by
Naidu Niren
Bought by
Mearns Frank W
Purchase Details
Closed on
Mar 1, 2011
Sold by
Mearns Frank W
Bought by
Five J Rentals Llc
Purchase Details
Closed on
Feb 1, 2011
Sold by
Naidu Niren
Bought by
Mearns Frank W
Purchase Details
Closed on
Feb 4, 2008
Sold by
Helen Cellar Inc
Bought by
Naidu Niren
Home Financials for this Owner
Home Financials are based on the most recent Mortgage that was taken out on this home.
Original Mortgage
$304,323
Interest Rate
6.06%
Mortgage Type
New Conventional
Create a Home Valuation Report for This Property
The Home Valuation Report is an in-depth analysis detailing your home's value as well as a comparison with similar homes in the area
Home Values in the Area
Average Home Value in this Area
Purchase History
| Date | Buyer | Sale Price | Title Company |
|---|---|---|---|
| Max Llc | -- | -- | |
| Hanover Tod | $250,000 | -- | |
| Hanover Tod | $250,000 | -- | |
| Mearns Frank W | $1,332,682 | -- | |
| Five J Rentals Llc | -- | -- | |
| Mearns Frank W | $1,332,682 | -- | |
| Naidu Niren | $1,800,893 | -- |
Source: Public Records
Mortgage History
| Date | Status | Borrower | Loan Amount |
|---|---|---|---|
| Previous Owner | Naidu Niren | $304,323 | |
| Previous Owner | Naidu Niren | $1,271,570 |
Source: Public Records
Tax History Compared to Growth
Tax History
| Year | Tax Paid | Tax Assessment Tax Assessment Total Assessment is a certain percentage of the fair market value that is determined by local assessors to be the total taxable value of land and additions on the property. | Land | Improvement |
|---|---|---|---|---|
| 2025 | $2,959 | $120,216 | $88,400 | $31,816 |
| 2024 | $2,959 | $120,216 | $88,400 | $31,816 |
| 2023 | $3,036 | $112,844 | $80,600 | $32,244 |
| 2022 | $3,219 | $112,844 | $80,600 | $32,244 |
| 2021 | $3,695 | $114,344 | $80,600 | $33,744 |
| 2020 | $4,025 | $118,844 | $80,600 | $38,244 |
| 2019 | $3,985 | $117,212 | $80,600 | $36,612 |
| 2018 | $3,511 | $102,204 | $65,592 | $36,612 |
| 2017 | $3,619 | $104,788 | $65,592 | $39,196 |
| 2016 | $3,455 | $100,000 | $62,000 | $38,000 |
| 2015 | $3,487 | $261,970 | $65,592 | $39,196 |
| 2014 | $3,626 | $271,110 | $0 | $0 |
Source: Public Records
Map
Nearby Homes
- 187 Alpenrosen Strasse
- 286 Alpenrosen Strasse Unit 1
- 892 Edelweiss Strasse
- 0 Ber Weg Unit 10605993
- 61 Ber Weg
- 327 Brucken Strasse Unit 603
- 327 Brucken Strasse Unit 311
- 327 Brucken Strasse Unit 601
- 854 Edelweiss Strasse Unit 301
- 46 Misty Weg Unit C
- 0 Erst Strasse Unit 10596308
- 74 Fussen Strasse
- 200 Bahn Innsbruck
- 26 Midway St Unit 203 & DOOR 20
- 26 Midway St Unit 205 & DOOR 202
- 144 Fussen Strasse
- 39 Schwarzwald Strasse
- 17 Dach Bruecke Gasse
- 159 Zeppelin Strasse
- 0 Zeppelin Strasse Unit 10624311
- 8078 S Main St
- 8088 S Main St
- 8047 S Main St
- 0 S Main St Unit 8474822
- 0 S Main St Unit 20114146
- 0 S Main St Unit 7170038
- 0 S Main St Unit 20100440
- 0 S Main St Unit 7166989
- 0 S Main St Unit 20093819
- 0 S Main St Unit 20088797
- 0 S Main St Unit 20075800
- 0 S Main St Unit 20068160
- 0 S Main St Unit 20059983
- 0 S Main St Unit 20051475
- 0 S Main St Unit 20041901
- 0 S Main St Unit 20034088
- 0 S Main St Unit 20025977
- 0 S Main St Unit 20017529
- 0 S Main St Unit 20015840
- 0 S Main St Unit 6985116