Estimated Value: $677,521 - $728,000
4
Beds
3
Baths
2,803
Sq Ft
$251/Sq Ft
Est. Value
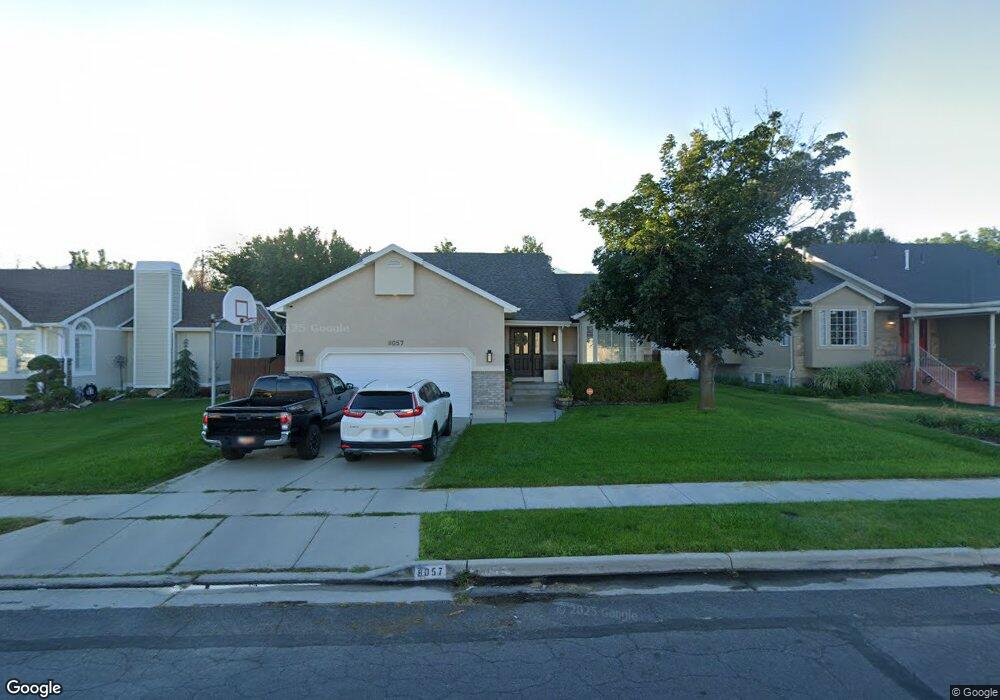
About This Home
This home is located at 8057 Nighthawk Dr, Sandy, UT 84094 and is currently estimated at $703,380, approximately $250 per square foot. 8057 Nighthawk Dr is a home located in Salt Lake County with nearby schools including East Sandy School, Union Middle School, and Hillcrest High School.
Ownership History
Date
Name
Owned For
Owner Type
Purchase Details
Closed on
Jan 3, 2025
Sold by
High Equity Llc
Bought by
Bergam Kevan and Bergam Sara Ashley
Current Estimated Value
Home Financials for this Owner
Home Financials are based on the most recent Mortgage that was taken out on this home.
Original Mortgage
$475,000
Outstanding Balance
$470,024
Interest Rate
6.84%
Mortgage Type
New Conventional
Estimated Equity
$233,356
Purchase Details
Closed on
Sep 15, 2023
Sold by
Goff Louis P and Mixon Robert L
Bought by
High Equity Llc
Purchase Details
Closed on
Apr 2, 2019
Sold by
Anderson Stephen R and Anderson Tami S
Bought by
Goff Louis P and Mixon Robert L
Home Financials for this Owner
Home Financials are based on the most recent Mortgage that was taken out on this home.
Original Mortgage
$430,350
Interest Rate
4.3%
Mortgage Type
New Conventional
Create a Home Valuation Report for This Property
The Home Valuation Report is an in-depth analysis detailing your home's value as well as a comparison with similar homes in the area
Home Values in the Area
Average Home Value in this Area
Purchase History
| Date | Buyer | Sale Price | Title Company |
|---|---|---|---|
| Bergam Kevan | -- | Monument Title | |
| High Equity Llc | -- | Monument Title | |
| Goff Louis P | -- | First American Title Ins Api |
Source: Public Records
Mortgage History
| Date | Status | Borrower | Loan Amount |
|---|---|---|---|
| Open | Bergam Kevan | $475,000 | |
| Previous Owner | Goff Louis P | $430,350 |
Source: Public Records
Tax History
| Year | Tax Paid | Tax Assessment Tax Assessment Total Assessment is a certain percentage of the fair market value that is determined by local assessors to be the total taxable value of land and additions on the property. | Land | Improvement |
|---|---|---|---|---|
| 2025 | $3,201 | $634,700 | $163,200 | $471,500 |
| 2024 | $3,201 | $591,200 | $157,000 | $434,200 |
| 2023 | $3,201 | $581,300 | $149,200 | $432,100 |
| 2022 | $3,654 | $580,800 | $146,300 | $434,500 |
| 2021 | $2,709 | $414,600 | $113,700 | $300,900 |
| 2020 | $2,923 | $375,400 | $113,700 | $261,700 |
| 2019 | $2,598 | $365,400 | $107,300 | $258,100 |
| 2016 | $2,153 | $291,400 | $107,300 | $184,100 |
Source: Public Records
Map
Nearby Homes
- 7899 S 930 E
- 760 E 8080 S
- 8268 S 865 E
- 798 E Spruce Tree Ln
- 7819 S Spruce Tree Ln
- 954 E 7725 S
- 8136 S Cottonwood Hills Cir
- 8087 S 615 E
- 8373 S 1100 E Unit 39
- 8390 S 745 E
- 7692 Chad St
- 7755 S 1130 E
- 991 Merewood Ct
- 7614 S 1000 E
- 744 E 8425 S
- 8485 S Harvard Park Dr
- 8322 S Levine Ln Unit 111
- 600 E Briarsprings Cir
- 8583 S Harvard Park Dr
- 7640 S Quail Springs Cir
- 8057 S Nighthawk Dr
- 8047 Nighthawk Dr
- 8067 S Nighthawk Dr
- 8067 Nighthawk Dr
- 8058 Peregrine Place
- 8058 S Peregrine Place
- 8048 Peregrine Place
- 8048 S Peregrine Place
- 8037 Nighthawk Dr
- 8037 S Nighthawk Dr
- 8068 Peregrine Place
- 8052 Nighthawk Dr
- 8062 Nighthawk Dr
- 8038 Peregrine Place
- 8038 S Peregrine Place
- 8042 Nighthawk Dr
- 8072 Nighthawk Dr
- 8029 S Nighthawk Dr
- 8029 Nighthawk Dr
- 934 E Peregrine Ln
Your Personal Tour Guide
Ask me questions while you tour the home.