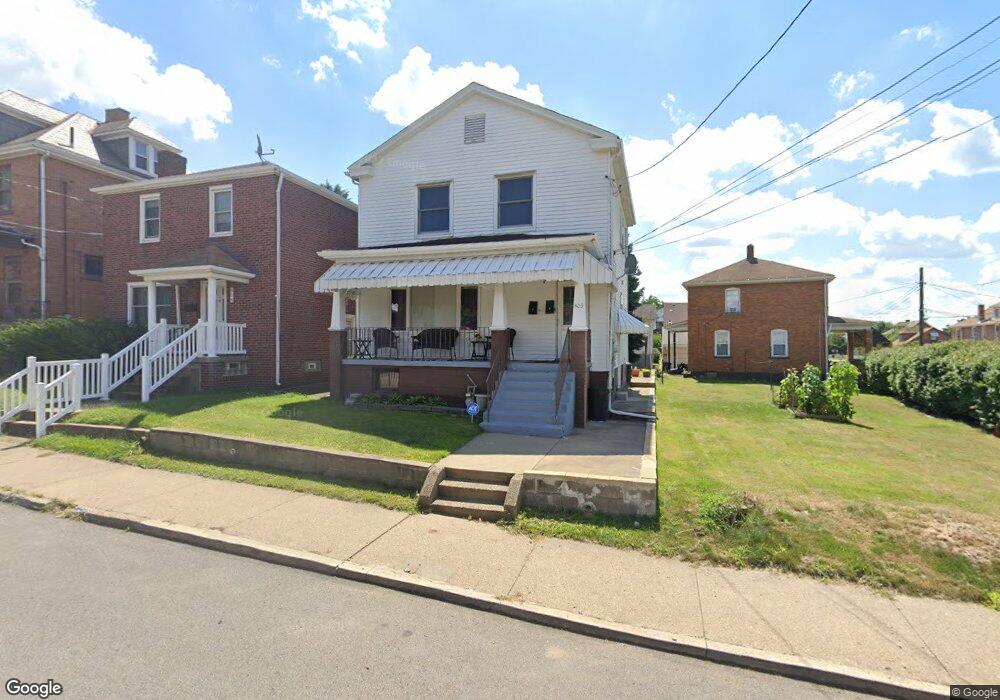
806 11th St Unit 1 Ambridge, PA 15003
Estimated Value: $117,000 - $131,000
1
Bed
1
Bath
1,344
Sq Ft
$93/Sq Ft
Est. Value
About This Home
This home is located at 806 11th St Unit 1, Ambridge, PA 15003 and is currently estimated at $124,437, approximately $92 per square foot. 806 11th St Unit 1 is a home located in Beaver County with nearby schools including Ambridge Area Middle School, Ambridge Area High School, and Baden Academy Charter School.
Ownership History
Date
Name
Owned For
Owner Type
Purchase Details
Closed on
Dec 4, 2020
Sold by
Baker Mark E and Baker Germaine A
Bought by
Mosley Nakeya L
Current Estimated Value
Home Financials for this Owner
Home Financials are based on the most recent Mortgage that was taken out on this home.
Original Mortgage
$3,460
Outstanding Balance
$3,081
Interest Rate
2.71%
Mortgage Type
New Conventional
Estimated Equity
$121,356
Purchase Details
Closed on
Jan 28, 2014
Sold by
Smonko John A
Bought by
Baker Mark E
Purchase Details
Closed on
May 26, 2009
Sold by
Johnstone Robert K and Johnstone Pauline
Bought by
Smonko John A
Home Financials for this Owner
Home Financials are based on the most recent Mortgage that was taken out on this home.
Original Mortgage
$38,817
Interest Rate
4.92%
Mortgage Type
VA
Create a Home Valuation Report for This Property
The Home Valuation Report is an in-depth analysis detailing your home's value as well as a comparison with similar homes in the area
Home Values in the Area
Average Home Value in this Area
Purchase History
| Date | Buyer | Sale Price | Title Company |
|---|---|---|---|
| Mosley Nakeya L | $90,000 | Barristers Land Abstract | |
| Baker Mark E | $42,000 | None Available | |
| Smonko John A | $38,000 | None Available |
Source: Public Records
Mortgage History
| Date | Status | Borrower | Loan Amount |
|---|---|---|---|
| Open | Mosley Nakeya L | $3,460 | |
| Open | Mosley Nakeya L | $84,859 | |
| Previous Owner | Smonko John A | $38,817 |
Source: Public Records
Tax History Compared to Growth
Tax History
| Year | Tax Paid | Tax Assessment Tax Assessment Total Assessment is a certain percentage of the fair market value that is determined by local assessors to be the total taxable value of land and additions on the property. | Land | Improvement |
|---|---|---|---|---|
| 2025 | $659 | $50,700 | $8,650 | $42,050 |
| 2024 | $2,238 | $50,700 | $8,650 | $42,050 |
| 2023 | $2,232 | $15,500 | $2,350 | $13,150 |
| 2022 | $2,232 | $15,500 | $2,350 | $13,150 |
| 2021 | $2,232 | $15,500 | $2,350 | $13,150 |
| 2020 | $2,200 | $15,500 | $2,350 | $13,150 |
| 2019 | $2,200 | $15,500 | $2,350 | $13,150 |
| 2018 | $2,167 | $15,500 | $2,350 | $13,150 |
| 2017 | $2,167 | $15,500 | $2,350 | $13,150 |
| 2016 | $2,055 | $15,500 | $2,350 | $13,150 |
| 2015 | $344 | $15,500 | $2,350 | $13,150 |
| 2014 | $344 | $15,500 | $2,350 | $13,150 |
Source: Public Records
Map
Nearby Homes