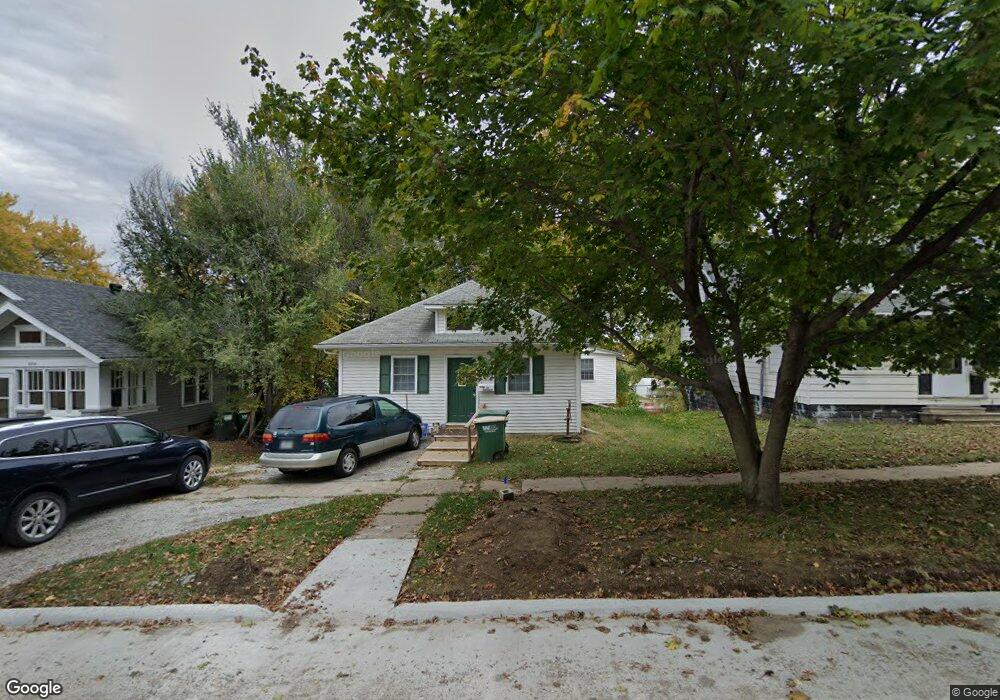
806 Adams St Corning, IA 50841
Estimated Value: $79,000 - $109,000
2
Beds
1
Bath
980
Sq Ft
$97/Sq Ft
Est. Value
About This Home
This home is located at 806 Adams St, Corning, IA 50841 and is currently estimated at $95,309, approximately $97 per square foot. 806 Adams St is a home.
Ownership History
Date
Name
Owned For
Owner Type
Purchase Details
Closed on
May 27, 2022
Sold by
Sorensen Mitchell and Sorensen Debra
Bought by
Saltus Llc
Current Estimated Value
Home Financials for this Owner
Home Financials are based on the most recent Mortgage that was taken out on this home.
Original Mortgage
$66,300
Outstanding Balance
$62,398
Interest Rate
4.75%
Mortgage Type
New Conventional
Estimated Equity
$32,911
Purchase Details
Closed on
May 4, 2021
Sold by
Lonnie Schafroth
Bought by
Sorensen Edward
Purchase Details
Closed on
Jun 11, 2018
Sold by
Lynn Schafroth and Lynn Linda
Bought by
Schafroth Lonnie
Home Financials for this Owner
Home Financials are based on the most recent Mortgage that was taken out on this home.
Original Mortgage
$32,000
Interest Rate
4.5%
Mortgage Type
New Conventional
Create a Home Valuation Report for This Property
The Home Valuation Report is an in-depth analysis detailing your home's value as well as a comparison with similar homes in the area
Purchase History
We collect this data history from publicly available records. To have your information removed, we recommend requesting removal directly through your county’s website.
| Date | Buyer | Sale Price | Title Company |
|---|---|---|---|
| Saltus Llc | $78,000 | -- | |
| Sorensen Edward | $65,000 | -- | |
| Schafroth Lonnie | $31,750 | -- |
Source: Public Records
Mortgage History
We collect this data history from publicly available records. To have your information removed, we recommend requesting removal directly through your county’s website.
| Date | Status | Borrower | Loan Amount |
|---|---|---|---|
| Open | Saltus Llc | $66,300 | |
| Previous Owner | Schafroth Lonnie | $32,000 |
Source: Public Records
Tax History
| Year | Tax Paid | Tax Assessment Tax Assessment Total Assessment is a certain percentage of the fair market value that is determined by local assessors to be the total taxable value of land and additions on the property. | Land | Improvement |
|---|---|---|---|---|
| 2025 | $1,772 | $93,600 | $5,600 | $88,000 |
| 2024 | $1,772 | $89,400 | $5,600 | $83,800 |
| 2023 | $1,724 | $89,400 | $5,600 | $83,800 |
| 2022 | $702 | $65,500 | $5,600 | $59,900 |
| 2021 | $670 | $36,500 | $1,800 | $34,700 |
| 2020 | $684 | $36,500 | $1,800 | $34,700 |
| 2019 | $684 | $36,512 | $0 | $0 |
| 2018 | $878 | $36,512 | $0 | $0 |
| 2017 | $986 | $40,112 | $0 | $0 |
| 2016 | $968 | $40,112 | $0 | $0 |
| 2015 | $810 | $33,426 | $0 | $0 |
| 2014 | $766 | $33,426 | $0 | $0 |
Source: Public Records
Map
Nearby Homes
Your Personal Tour Guide
Ask me questions while you tour the home.