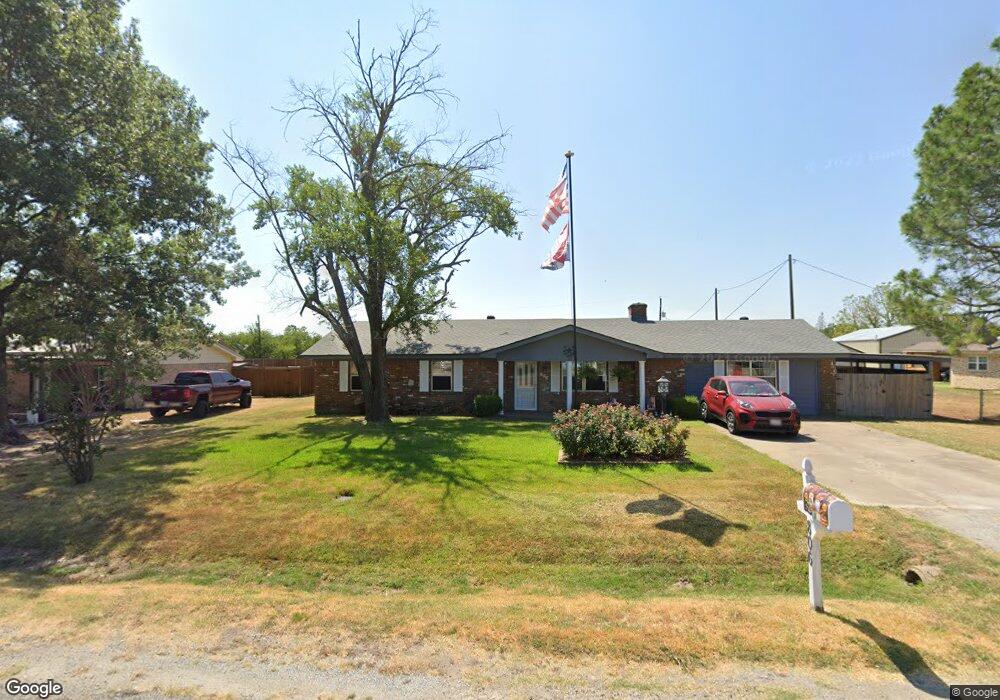
806 Amy Way Bonham, TX 75418
Estimated Value: $252,017 - $327,000
3
Beds
2
Baths
1,724
Sq Ft
$164/Sq Ft
Est. Value
About This Home
This home is located at 806 Amy Way, Bonham, TX 75418 and is currently estimated at $282,754, approximately $164 per square foot. 806 Amy Way is a home located in Fannin County with nearby schools including Finley-Oates Elementary School and LH Rather Jr High School.
Ownership History
Date
Name
Owned For
Owner Type
Purchase Details
Closed on
Aug 15, 2019
Sold by
Barsi Jeffrey D and Barsi Kyra
Bought by
Terk Benjamin and Terk Vicki
Current Estimated Value
Home Financials for this Owner
Home Financials are based on the most recent Mortgage that was taken out on this home.
Original Mortgage
$82,478
Outstanding Balance
$73,077
Interest Rate
4.49%
Mortgage Type
FHA
Estimated Equity
$209,677
Purchase Details
Closed on
Feb 16, 2017
Sold by
Secretary Of Hud
Bought by
Barsi Jeffrey D
Purchase Details
Closed on
May 31, 2013
Sold by
Trompler Kevin W and Trompler Kelly Terese
Bought by
Quintero Leeann
Home Financials for this Owner
Home Financials are based on the most recent Mortgage that was taken out on this home.
Original Mortgage
$93,279
Interest Rate
3.25%
Mortgage Type
FHA
Create a Home Valuation Report for This Property
The Home Valuation Report is an in-depth analysis detailing your home's value as well as a comparison with similar homes in the area
Home Values in the Area
Average Home Value in this Area
Purchase History
| Date | Buyer | Sale Price | Title Company |
|---|---|---|---|
| Terk Benjamin | -- | Cole Title Co | |
| Barsi Jeffrey D | -- | None Available | |
| Quintero Leeann | -- | Cole Title Company |
Source: Public Records
Mortgage History
| Date | Status | Borrower | Loan Amount |
|---|---|---|---|
| Open | Terk Benjamin | $82,478 | |
| Previous Owner | Quintero Leeann | $93,279 |
Source: Public Records
Tax History Compared to Growth
Tax History
| Year | Tax Paid | Tax Assessment Tax Assessment Total Assessment is a certain percentage of the fair market value that is determined by local assessors to be the total taxable value of land and additions on the property. | Land | Improvement |
|---|---|---|---|---|
| 2025 | $1,231 | $225,790 | $28,650 | $197,140 |
| 2024 | $1,231 | $192,390 | $28,650 | $163,740 |
| 2023 | $2,069 | $203,270 | $27,900 | $175,370 |
| 2022 | $2,142 | $165,230 | $21,790 | $143,440 |
| 2021 | $2,234 | $119,330 | $10,210 | $109,120 |
| 2020 | $2,159 | $113,540 | $7,470 | $106,070 |
| 2019 | $2,102 | $106,650 | $6,480 | $100,170 |
| 2018 | $1,860 | $94,560 | $6,480 | $88,080 |
| 2017 | $1,684 | $89,310 | $6,480 | $82,830 |
| 2016 | $1,613 | $85,530 | $6,510 | $79,020 |
| 2015 | -- | $95,120 | $6,510 | $88,610 |
| 2014 | -- | $92,080 | $6,540 | $85,540 |
Source: Public Records
Map
Nearby Homes