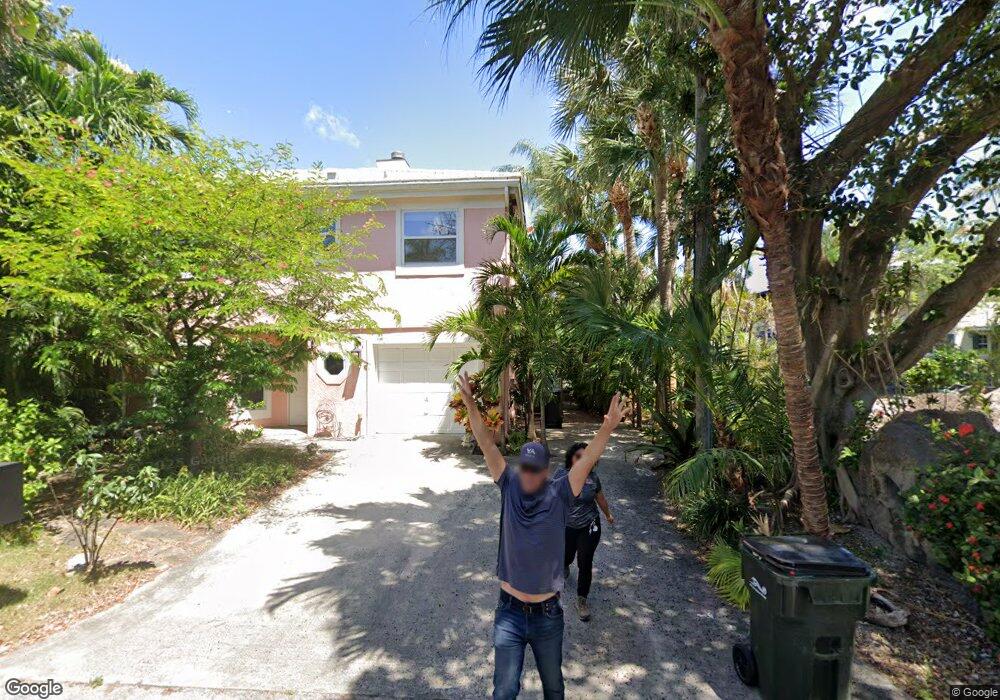
806 Andrews Ave Delray Beach, FL 33483
Gulfstream NeighborhoodEstimated Value: $1,485,126 - $1,894,000
4
Beds
3
Baths
1,764
Sq Ft
$947/Sq Ft
Est. Value
About This Home
This home is located at 806 Andrews Ave, Delray Beach, FL 33483 and is currently estimated at $1,671,032, approximately $947 per square foot. 806 Andrews Ave is a home located in Palm Beach County with nearby schools including Plumosa School of the Arts, Carver Middle School, and Atlantic High School.
Ownership History
Date
Name
Owned For
Owner Type
Purchase Details
Closed on
Oct 31, 2018
Sold by
Bonfils James S and Bonfils Andrea L
Bought by
Thompson Mary E and Mary E Thompson Trust
Current Estimated Value
Purchase Details
Closed on
Oct 30, 2018
Sold by
Bonfils Darcy Reyne
Bought by
Thompson Mary E and Mary E Thompson Trust
Purchase Details
Closed on
Mar 24, 2006
Sold by
Stemm Bonfils Darcy and Stemm Bonfils James
Bought by
Bonfils James R
Purchase Details
Closed on
Aug 12, 2004
Sold by
Bonfils Darcy and Bonfils James S
Bought by
Bonfils Darcy and Bonfils James S
Purchase Details
Closed on
Feb 27, 1996
Sold by
Bonfils Darcy Renee and Bonfils James Stemm
Bought by
Bonfils Darcy
Home Financials for this Owner
Home Financials are based on the most recent Mortgage that was taken out on this home.
Original Mortgage
$32,000
Interest Rate
7.03%
Mortgage Type
New Conventional
Purchase Details
Closed on
Jan 3, 1994
Sold by
Great Western Bk
Bought by
E M C Mtg Corp
Create a Home Valuation Report for This Property
The Home Valuation Report is an in-depth analysis detailing your home's value as well as a comparison with similar homes in the area
Home Values in the Area
Average Home Value in this Area
Purchase History
| Date | Buyer | Sale Price | Title Company |
|---|---|---|---|
| Thompson Mary E | $482,500 | None Available | |
| Thompson Mary E | $482,500 | None Available | |
| Bonfils James R | -- | Attorney | |
| Bonfils Darcy | -- | -- | |
| Bonfils Darcy | $100 | -- | |
| E M C Mtg Corp | $120,400 | -- |
Source: Public Records
Mortgage History
| Date | Status | Borrower | Loan Amount |
|---|---|---|---|
| Previous Owner | Bonfils Darcy | $32,000 |
Source: Public Records
Tax History Compared to Growth
Tax History
| Year | Tax Paid | Tax Assessment Tax Assessment Total Assessment is a certain percentage of the fair market value that is determined by local assessors to be the total taxable value of land and additions on the property. | Land | Improvement |
|---|---|---|---|---|
| 2024 | $20,153 | $945,232 | -- | -- |
| 2023 | $18,827 | $859,302 | $926,558 | $290,887 |
| 2022 | $16,843 | $781,184 | $0 | $0 |
| 2021 | $14,565 | $710,167 | $577,500 | $132,667 |
| 2020 | $15,126 | $731,735 | $632,500 | $99,235 |
| 2019 | $15,296 | $731,875 | $632,500 | $99,375 |
| 2018 | $12,693 | $618,563 | $545,113 | $73,450 |
| 2017 | $12,516 | $625,936 | $436,090 | $189,846 |
| 2016 | $6,284 | $530,812 | $0 | $0 |
| 2015 | $12,040 | $482,556 | $0 | $0 |
| 2014 | $10,160 | $438,687 | $0 | $0 |
Source: Public Records
Map
Nearby Homes
- 800 Andrews Ave Unit 9
- 802 Andrews Ave
- 1177 George Bush Blvd Unit 306
- 1234 George Bush Blvd
- 1246 George Bush Blvd
- 790 Andrews Ave Unit H202
- 1211 Hammond Rd
- 1001 Palm Trail
- 914 Palm Trail
- 518 Harbor Ct
- 812 Palm Trail
- 526 N Ocean Blvd
- 810 Palm Trail
- 1005 NE 9th Ave
- 1216 Palm Trail
- 410 N Ocean Blvd
- 1117 Beach Dr
- 1001 NE 8th Ave Unit 112
- 1001 NE 8th Ave Unit 209
- 800 Bond Way
- 804 Andrews Ave
- 800 Andrews Ave Unit 16
- 800 Andrews Ave Unit 12
- 800 Andrews Ave Unit 7
- 800 Andrews Ave Unit 15
- 800 Andrews Ave Unit 2
- 800 Andrews Ave Unit 1
- 800 Andrews Ave Unit 3
- 800 Andrews Ave Unit 10
- 800 Andrews Ave Unit 14
- 800 Andrews Ave Unit 11
- 800 Andrews Ave Unit 6
- 800 Andrews Ave Unit 4
- 800 Andrews Ave Unit 13
- 810 Andrews Ave
- 824 Andrews Ave
- 797 Andrews Ave
- 996 Pelican Ln
- 1177 George Bush Blvd Unit 307
- 1177 George Bush Blvd Unit 303