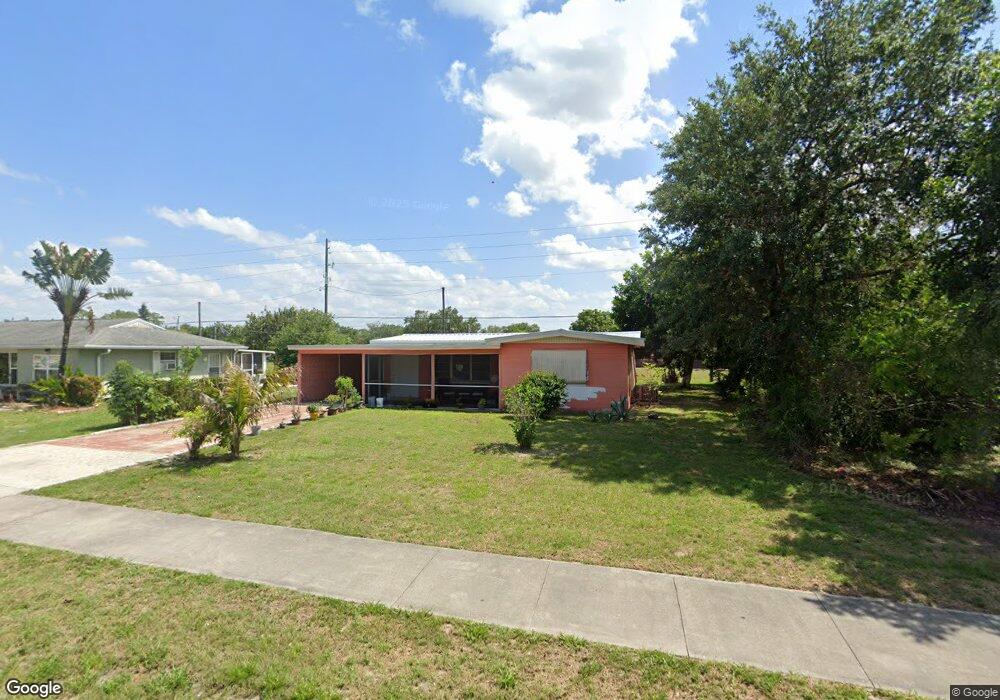
806 Arthur Ave Lehigh Acres, FL 33936
Alabama NeighborhoodEstimated Value: $192,624 - $270,000
2
Beds
1
Bath
1,139
Sq Ft
$194/Sq Ft
Est. Value
About This Home
This home is located at 806 Arthur Ave, Lehigh Acres, FL 33936 and is currently estimated at $220,406, approximately $193 per square foot. 806 Arthur Ave is a home located in Lee County with nearby schools including Lehigh Elementary School, Gateway Elementary School, and The Alva School.
Ownership History
Date
Name
Owned For
Owner Type
Purchase Details
Closed on
Jan 10, 2020
Sold by
Suggs Rentals Llc
Bought by
Suggs Benjamin W and Suggs Ashley N
Current Estimated Value
Purchase Details
Closed on
Dec 23, 2011
Sold by
Kevnan Inc
Bought by
Suggs Rentals Llc
Purchase Details
Closed on
Dec 7, 2000
Sold by
Williamson Kevin M and Williamson Nancy L
Bought by
Kevnan Inc
Home Financials for this Owner
Home Financials are based on the most recent Mortgage that was taken out on this home.
Original Mortgage
$40,005
Interest Rate
7.75%
Purchase Details
Closed on
Oct 31, 2000
Sold by
Keynan Inc
Bought by
Williamson Kevin M and Williamson Nancy L
Home Financials for this Owner
Home Financials are based on the most recent Mortgage that was taken out on this home.
Original Mortgage
$40,005
Interest Rate
7.75%
Purchase Details
Closed on
Nov 17, 1999
Sold by
Hopkinson Colin
Bought by
Kevnan Inc
Create a Home Valuation Report for This Property
The Home Valuation Report is an in-depth analysis detailing your home's value as well as a comparison with similar homes in the area
Home Values in the Area
Average Home Value in this Area
Purchase History
| Date | Buyer | Sale Price | Title Company |
|---|---|---|---|
| Suggs Benjamin W | -- | None Available | |
| Suggs Rentals Llc | $32,500 | Florida Title One Llc | |
| Kevnan Inc | -- | -- | |
| Williamson Kevin M | $36,300 | -- | |
| Kevnan Inc | $23,000 | -- |
Source: Public Records
Mortgage History
| Date | Status | Borrower | Loan Amount |
|---|---|---|---|
| Previous Owner | Williamson Kevin M | $40,005 |
Source: Public Records
Tax History Compared to Growth
Tax History
| Year | Tax Paid | Tax Assessment Tax Assessment Total Assessment is a certain percentage of the fair market value that is determined by local assessors to be the total taxable value of land and additions on the property. | Land | Improvement |
|---|---|---|---|---|
| 2025 | $2,167 | $91,643 | -- | -- |
| 2024 | $1,800 | $83,312 | -- | -- |
| 2023 | $1,800 | $75,738 | $0 | $0 |
| 2022 | $1,665 | $68,853 | $0 | $0 |
| 2021 | $1,428 | $85,118 | $9,940 | $75,178 |
| 2020 | $1,352 | $75,909 | $8,500 | $67,409 |
| 2019 | $1,412 | $72,677 | $7,800 | $64,877 |
| 2018 | $1,326 | $65,412 | $7,300 | $58,112 |
| 2017 | $1,221 | $56,521 | $6,840 | $49,681 |
| 2016 | $1,112 | $46,176 | $7,090 | $39,086 |
| 2015 | $1,058 | $42,599 | $5,943 | $36,656 |
| 2014 | $781 | $35,603 | $4,406 | $31,197 |
| 2013 | -- | $29,201 | $2,587 | $26,614 |
Source: Public Records
Map
Nearby Homes
- 1003 Arthur Ave
- 804 Alcala Ave
- 15 Willow St
- 808 Coral Ave
- 18 Alcala Ave
- 30 Desert Candle Cir
- 20 Westminster St N
- 22 Westminster St N
- 46 Desert Candle Cir
- 1116 Westminster St W
- 26 Pinewood Blvd
- 710 Fillmore Ave Unit 9
- 706 Arthur Ave
- 24 Pinewood Blvd
- 112 Alabama Rd S
- 19 Pinewood Blvd
- 1106 Broad St N
- 1116 Broad St N
- 602 Arthur Ave
- 121 Andros St
- 804 Arthur Ave
- 802 Arthur Ave
- 902 Arthur Ave
- 3 Homestead Rd N
- 803 Arthur Ave
- 711 Alcala Ave
- 709 Alcala Ave
- 801 Alcala Ave
- 904 Arthur Ave
- 707 Alcala Ave
- 803 Alcala Ave
- 9 Homestead Rd N
- 705 Alcala Ave
- 900 Adams Ave
- 905 Arthur Ave Unit 1
- 805 Alcala Ave
- 712 Adams Ave
- 710 Alcala Ave
- 800 Alcala Ave
- 902 Adams Ave